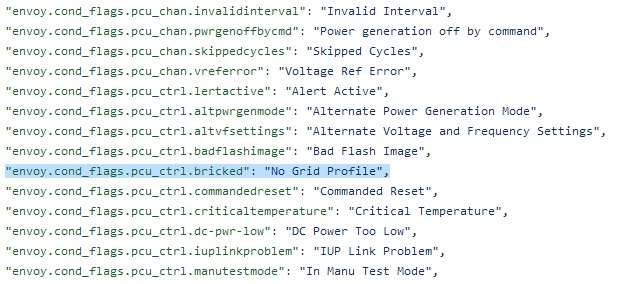
'No Grid Profile' means the inverter has bricked,
and then, recovered by watch-dog reset.
and, 5min start-up delay.
If say a result first, nothing improved yet.
More evidence(users) are complaining Ehphase IQ7+ Inverters are showing Random Produciton Drop with 'No Grid Profile' error with Firmware v4.27 or v4.28. I have thought firmware v4.28 can resolve the issue, but, not.
Now, I decide to change wiring for all inverters to check the difference.
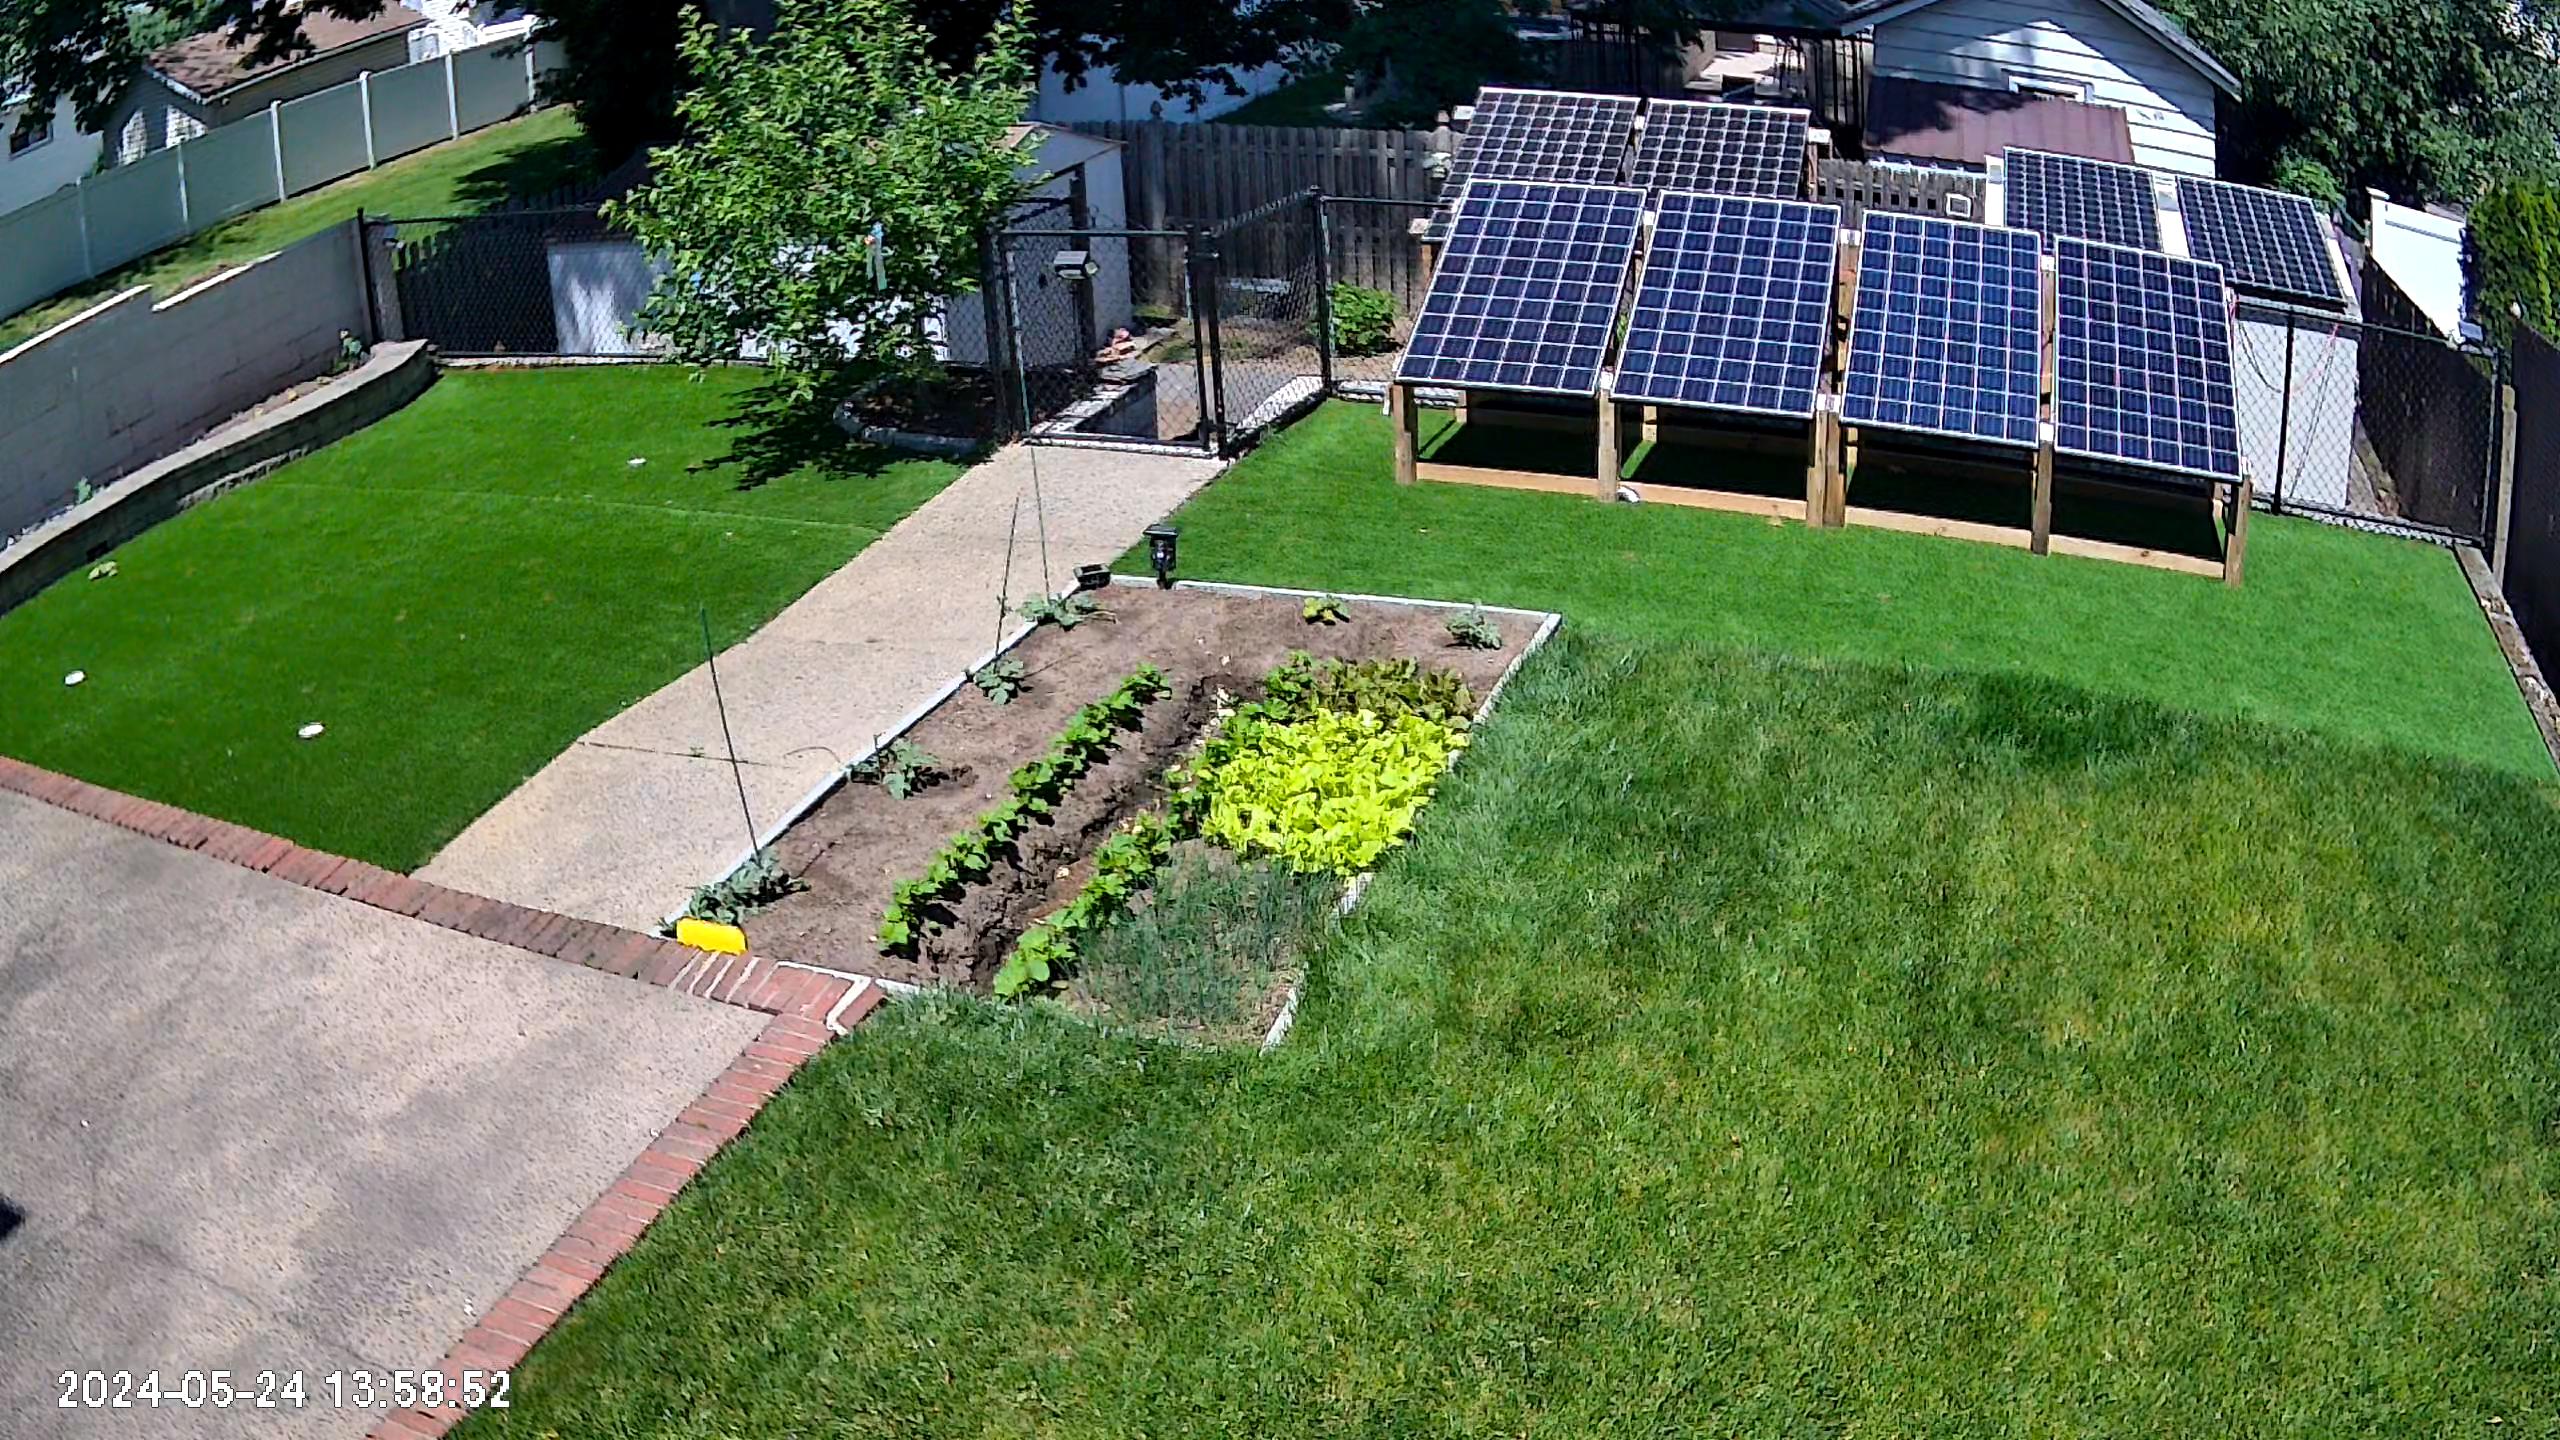
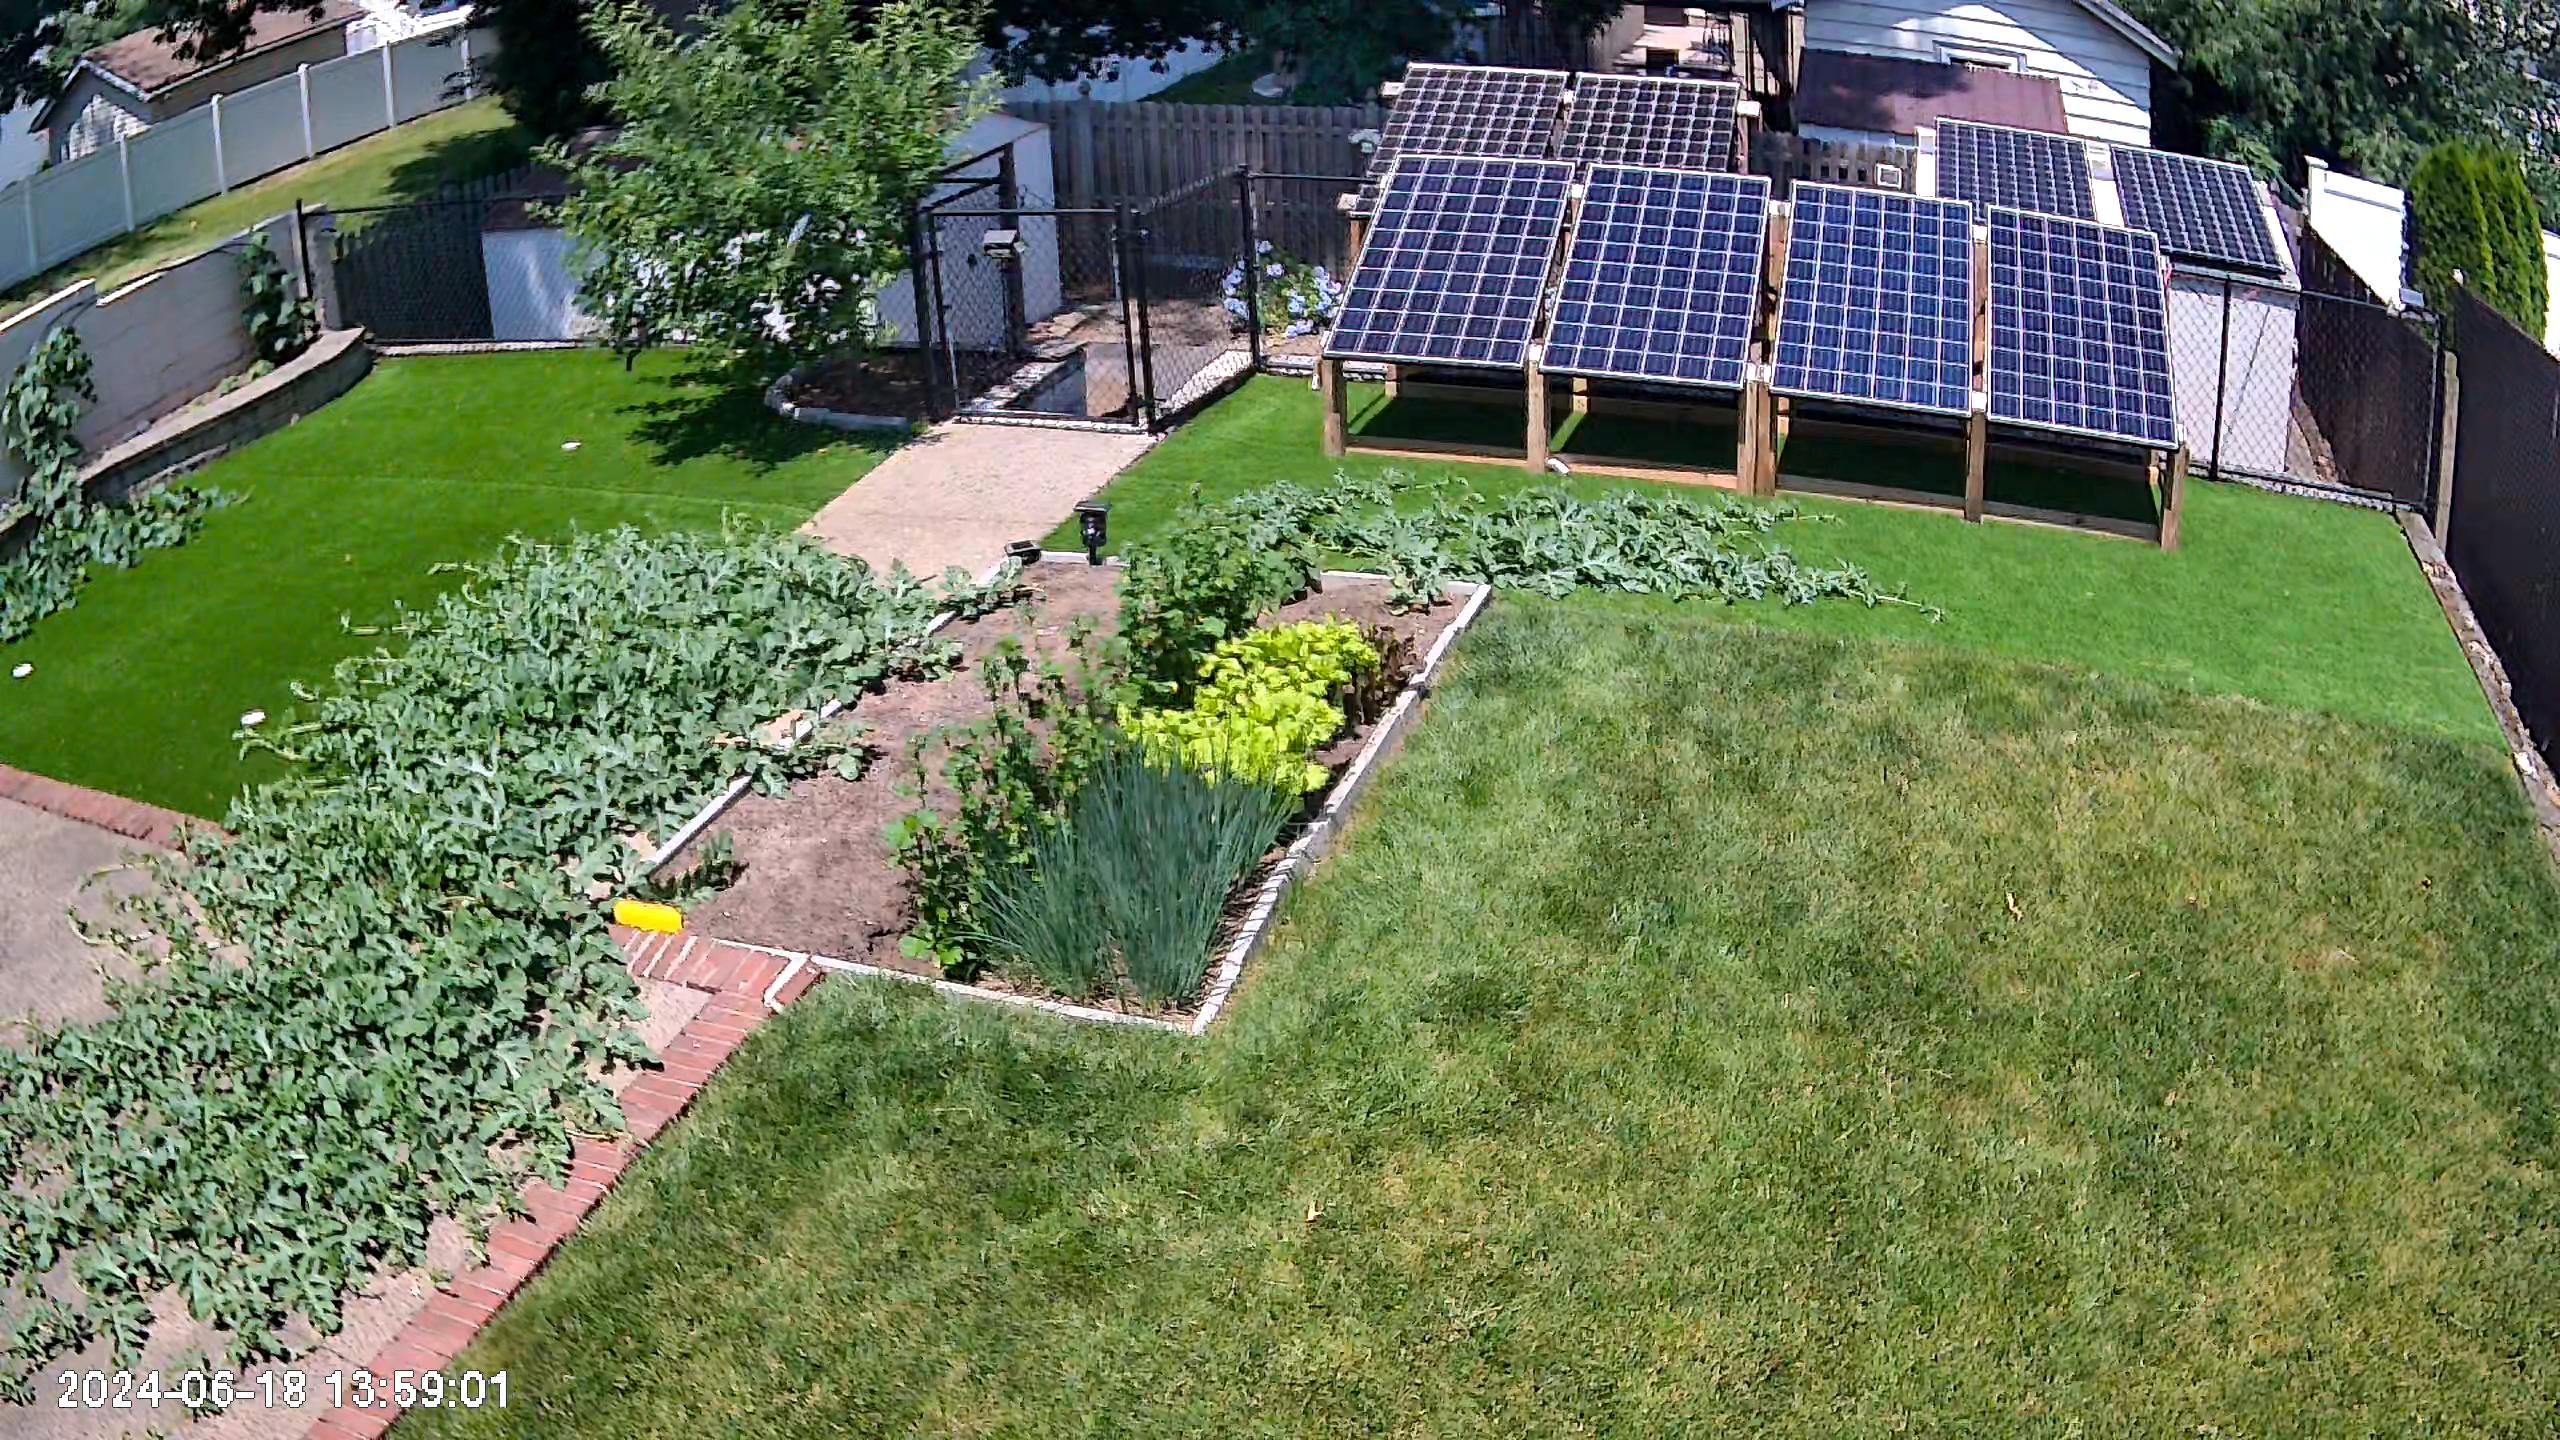
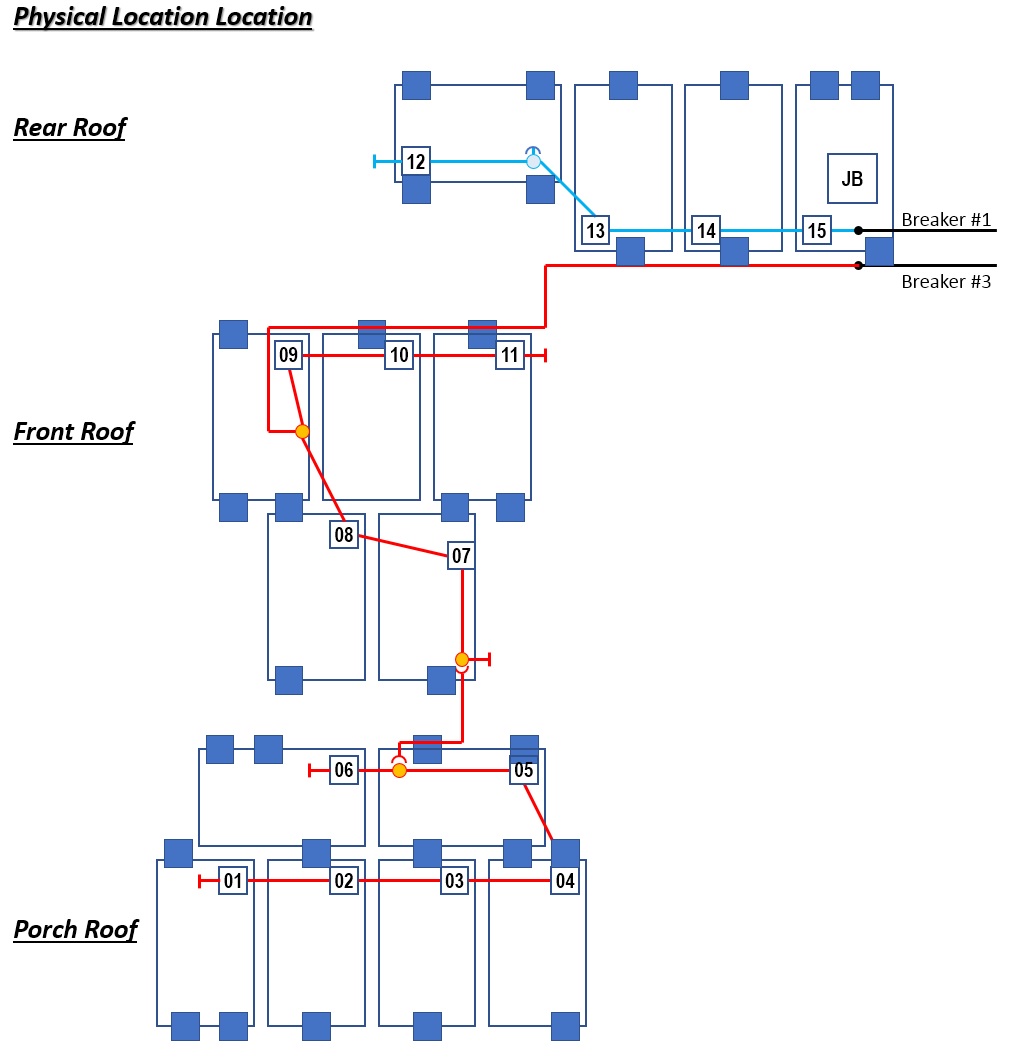
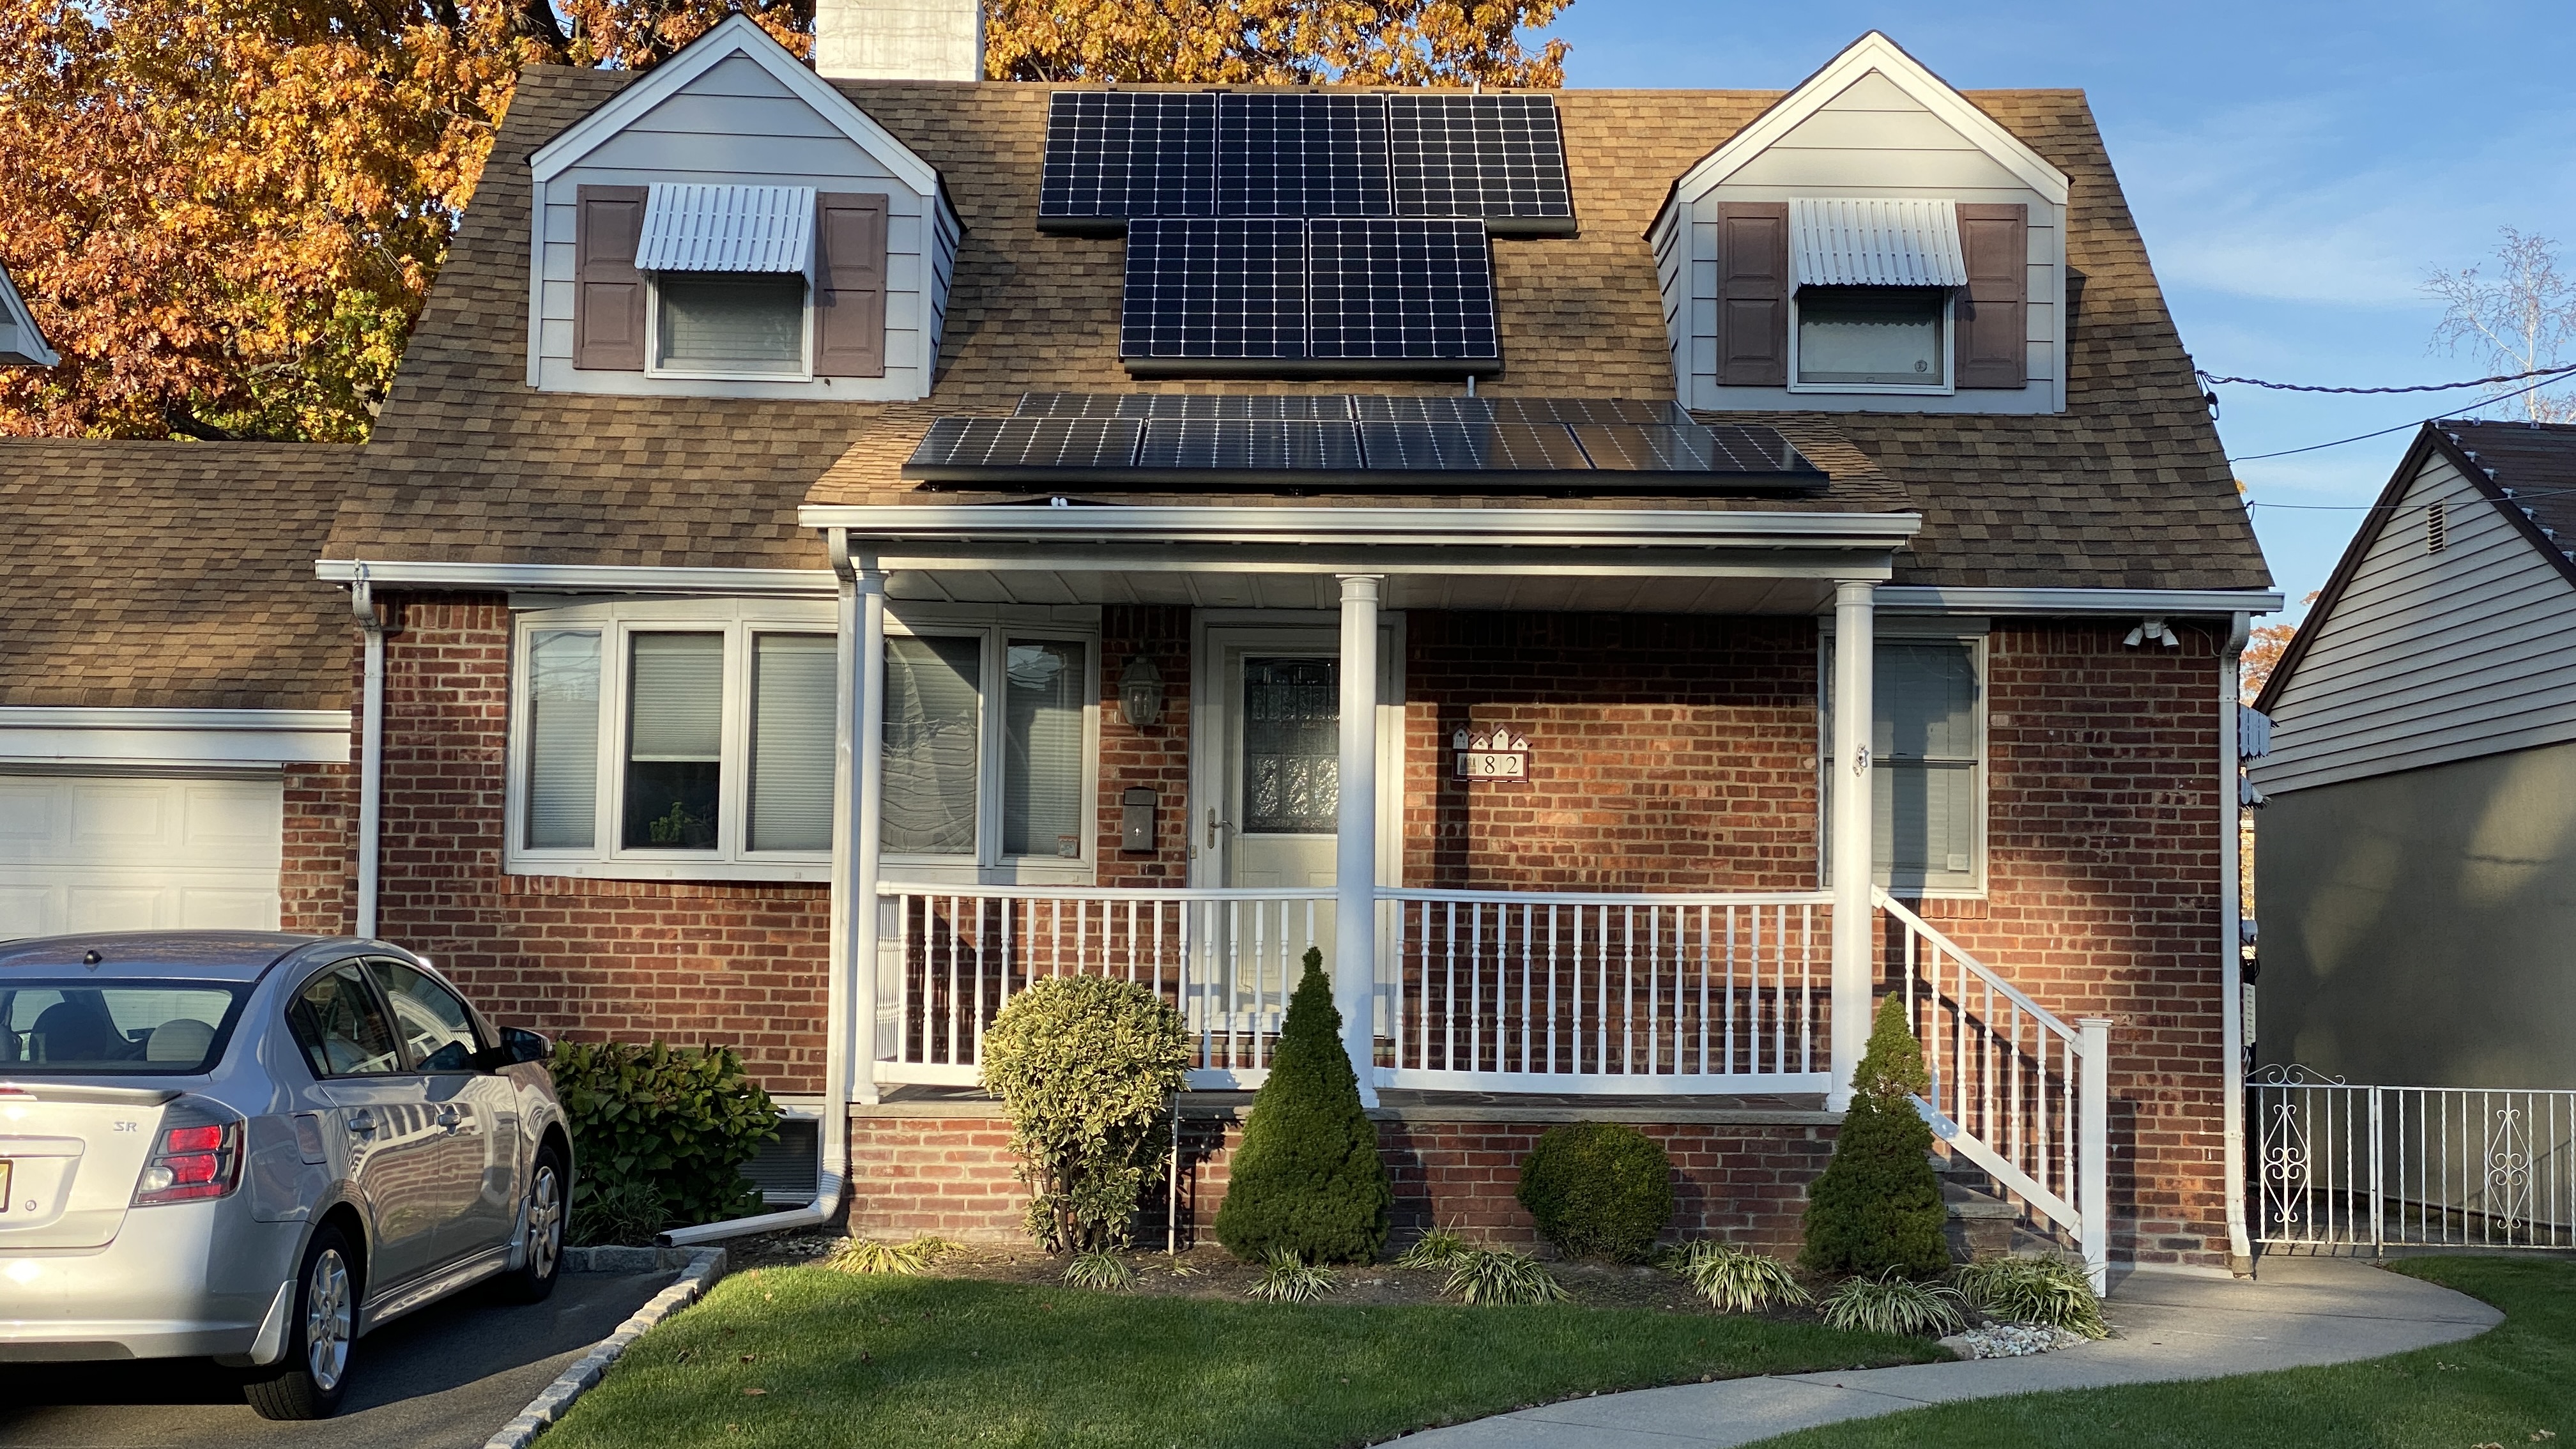
This is the current layout, there is no issue at Rear Roof, Only issue at Front Side Upper/Lower Roof.
So, I just try to simplify the front root layout.
This is the current layout,
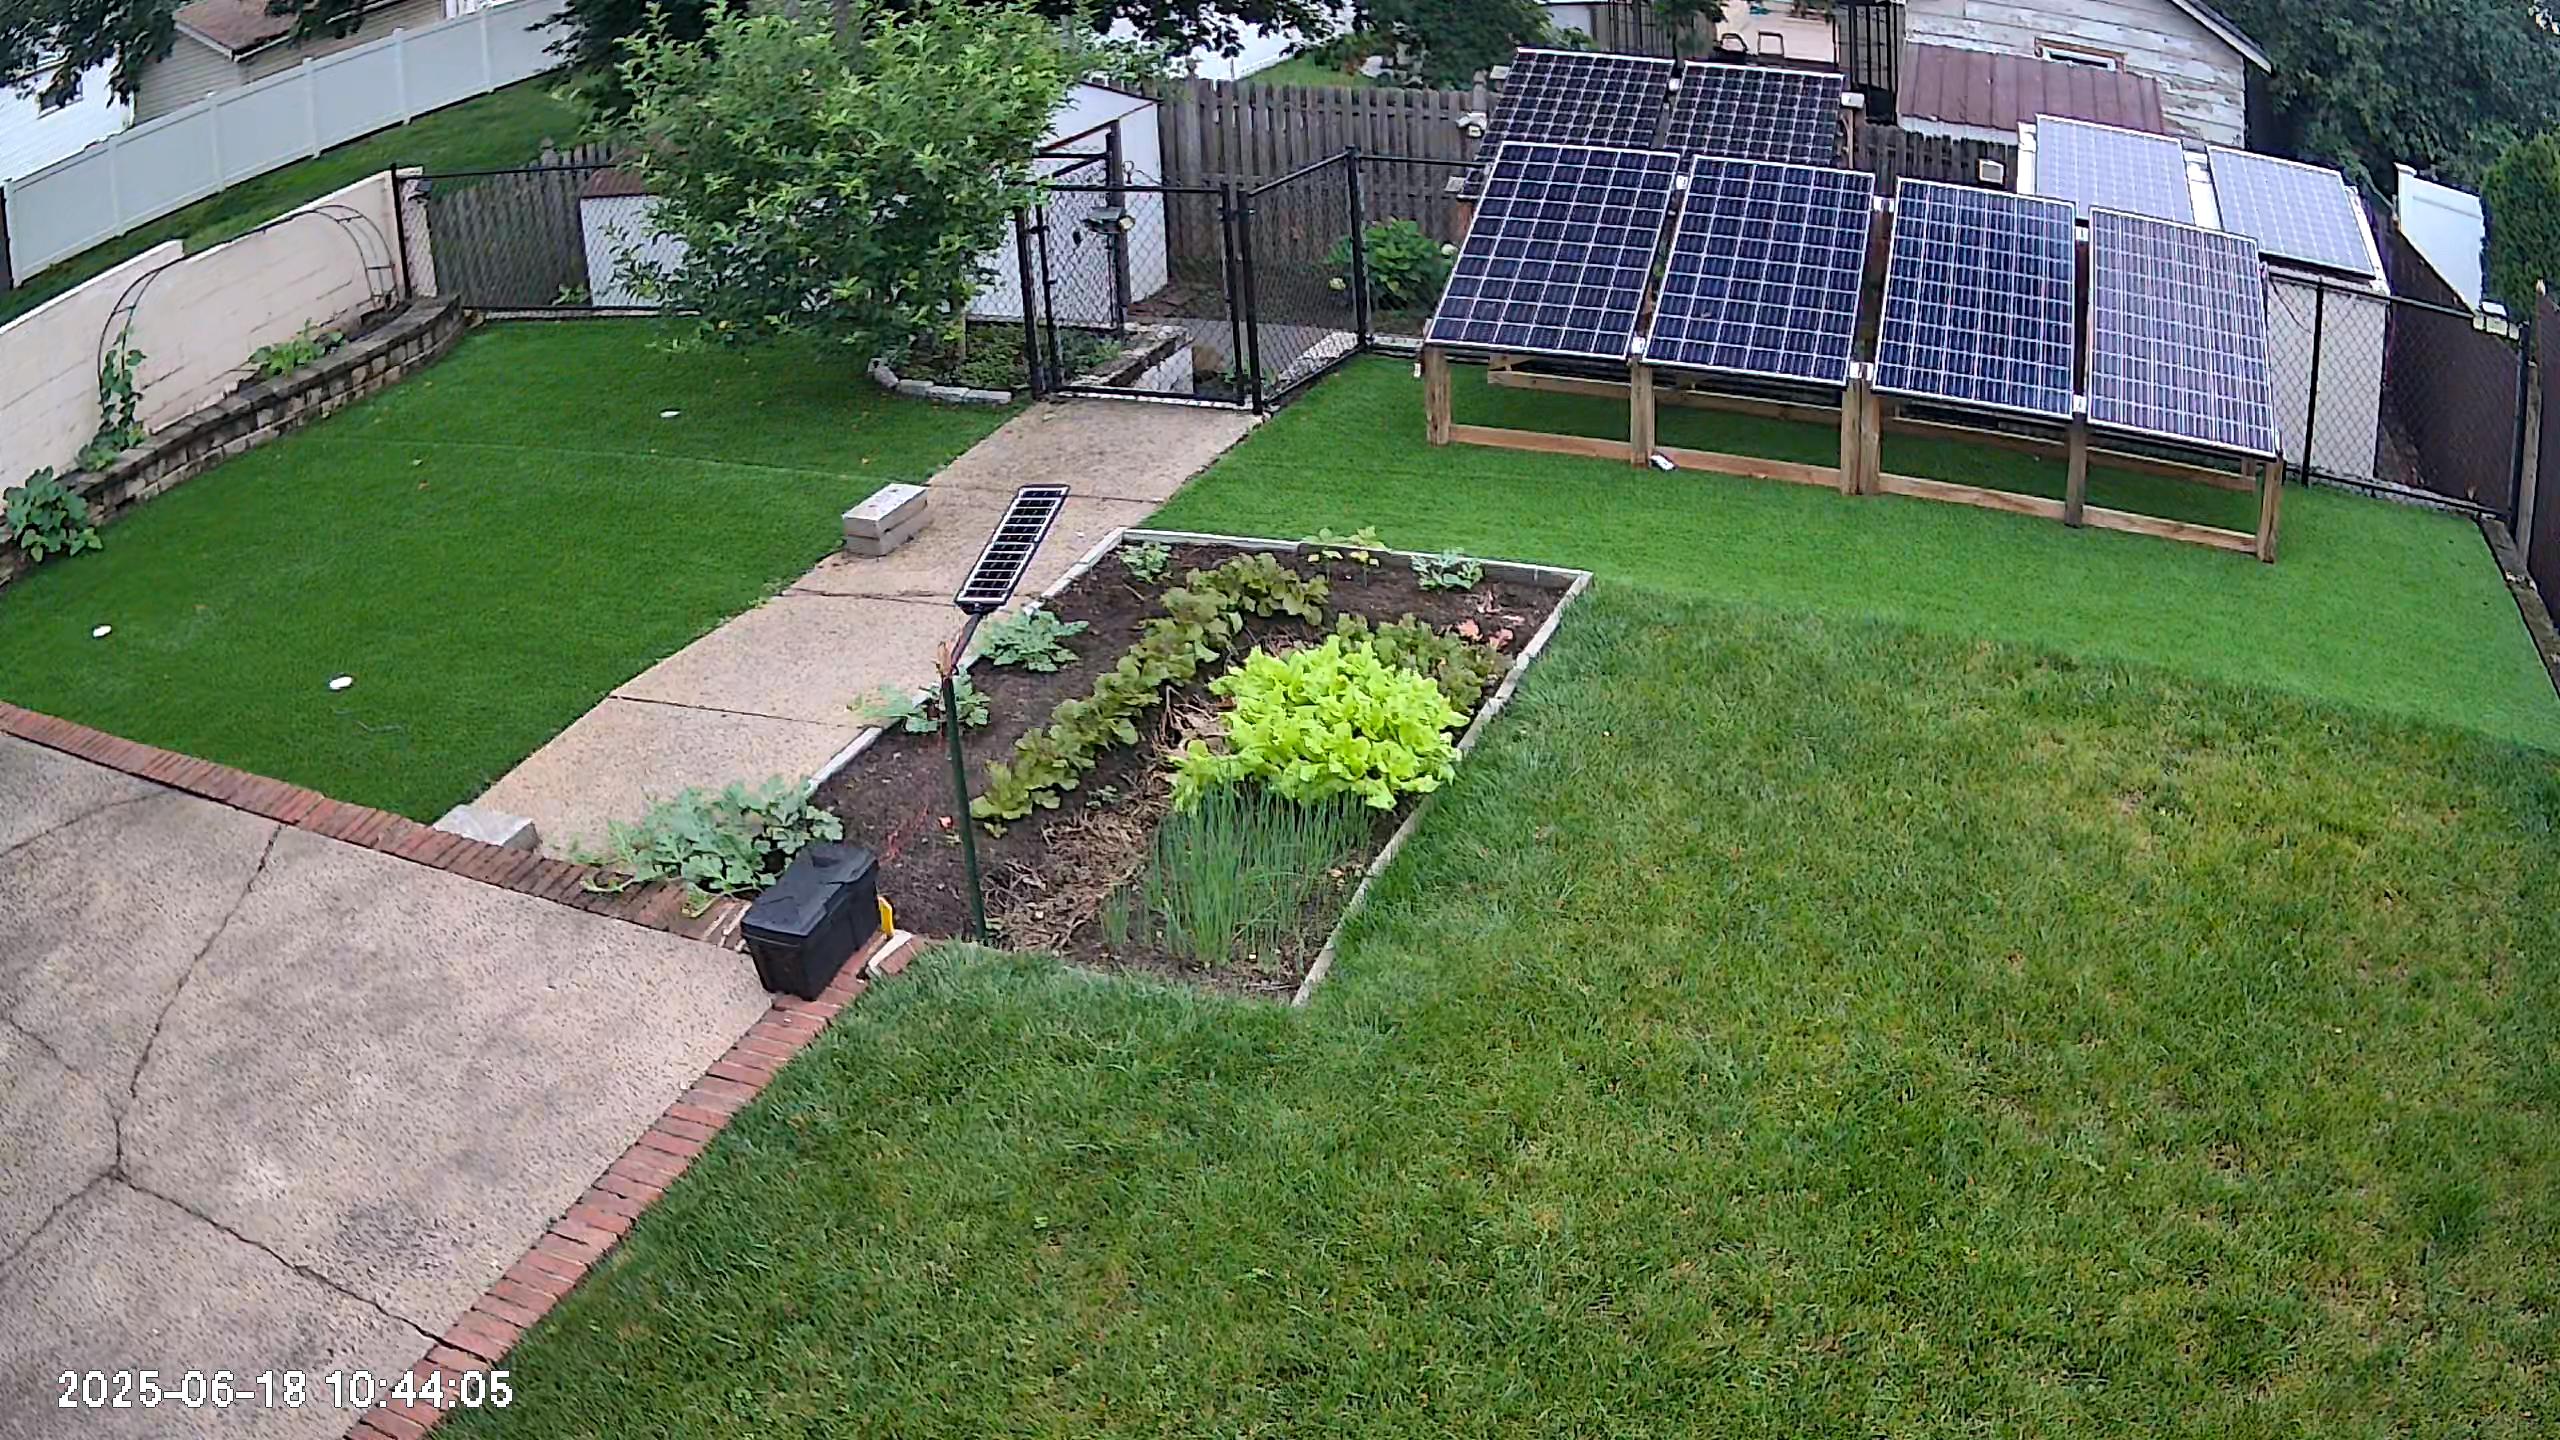
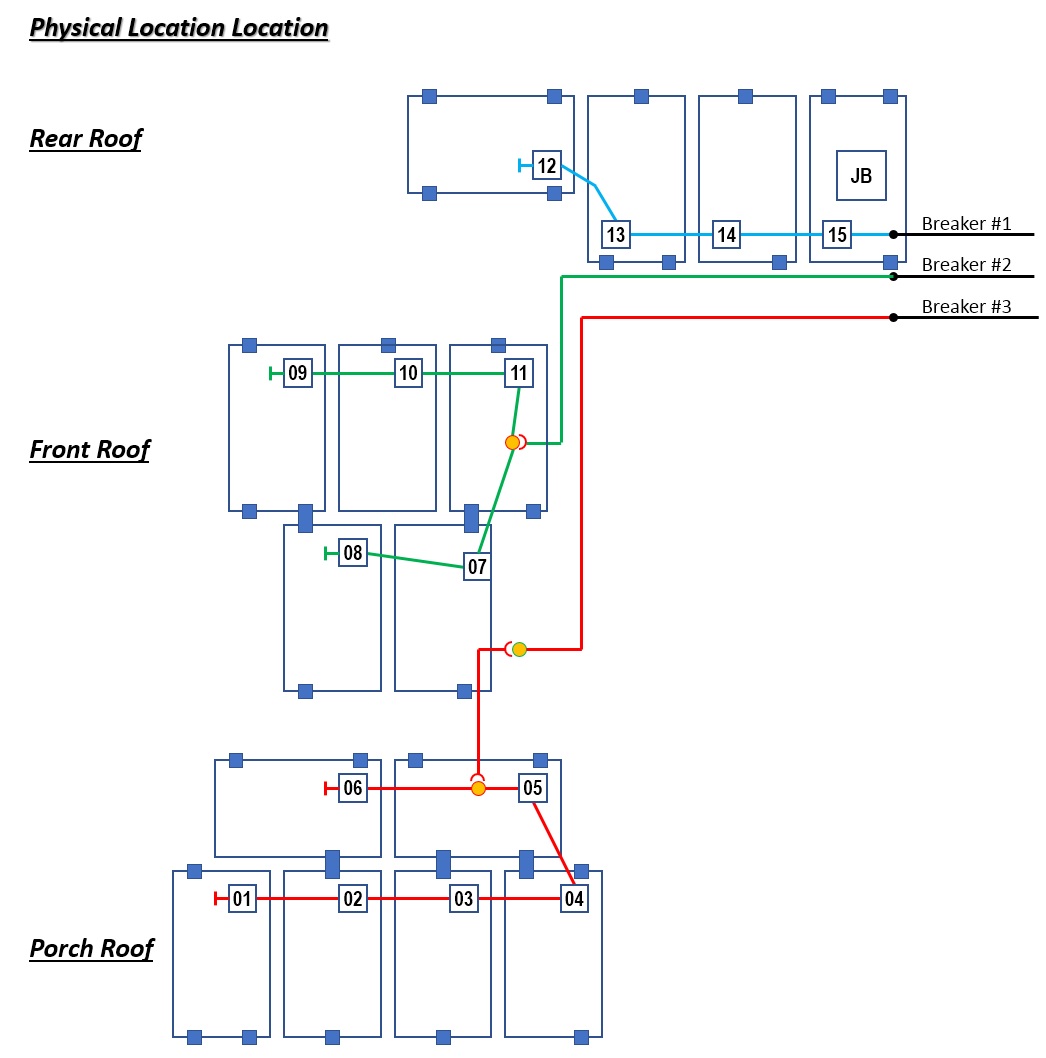
i have updated the layout as below
(1) rear roof - I have reduced the Q-cable length by 4'
(2) front roof - change the wiring, and reduce the power on the wire by half. the length has reduced by 4'. and, it is a new wire from roof to load-center usung 10 AWG THHN-2, have installed an independent breaker.
(3) porch - direct to JB, No more path thru on front roof panels, so, the power path have reduced by 12'
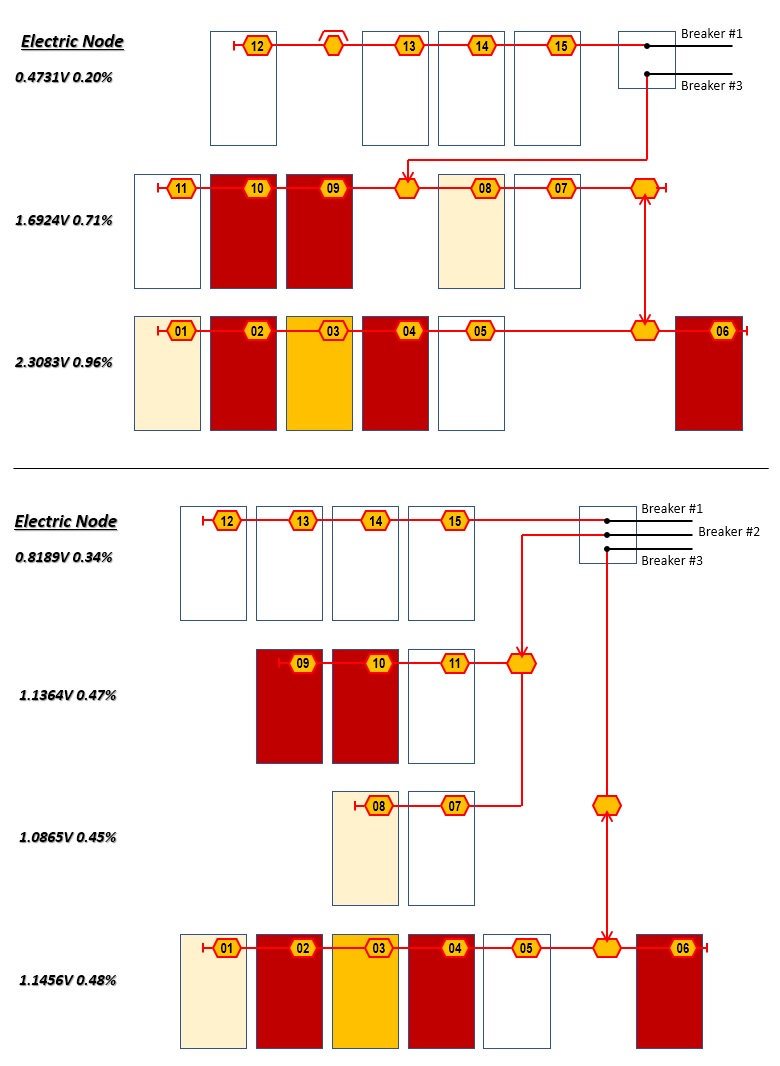
Base on my calculation, this change has lmproved for the voltage rising and interference of panels (inverters).
The first day of test, I cannot find any noticeable difference. actually, the inverters are showing error continously. (OTL), but, I wish to compare the difference before/after the layout changes (if there is any improvements)
I am sharing a question on Enphase Community
It is a known issue, but, No one answer it.
It is a FW of Inverter or Inverter's Problem,
Due to this issue, can lost 2-4% Pure Production in System,
Because eqch drop will affect 1.5% lost.
// Contents //
I have bought Paid Manager service to check in detail,
I just find any advice or idea who have experienced it before
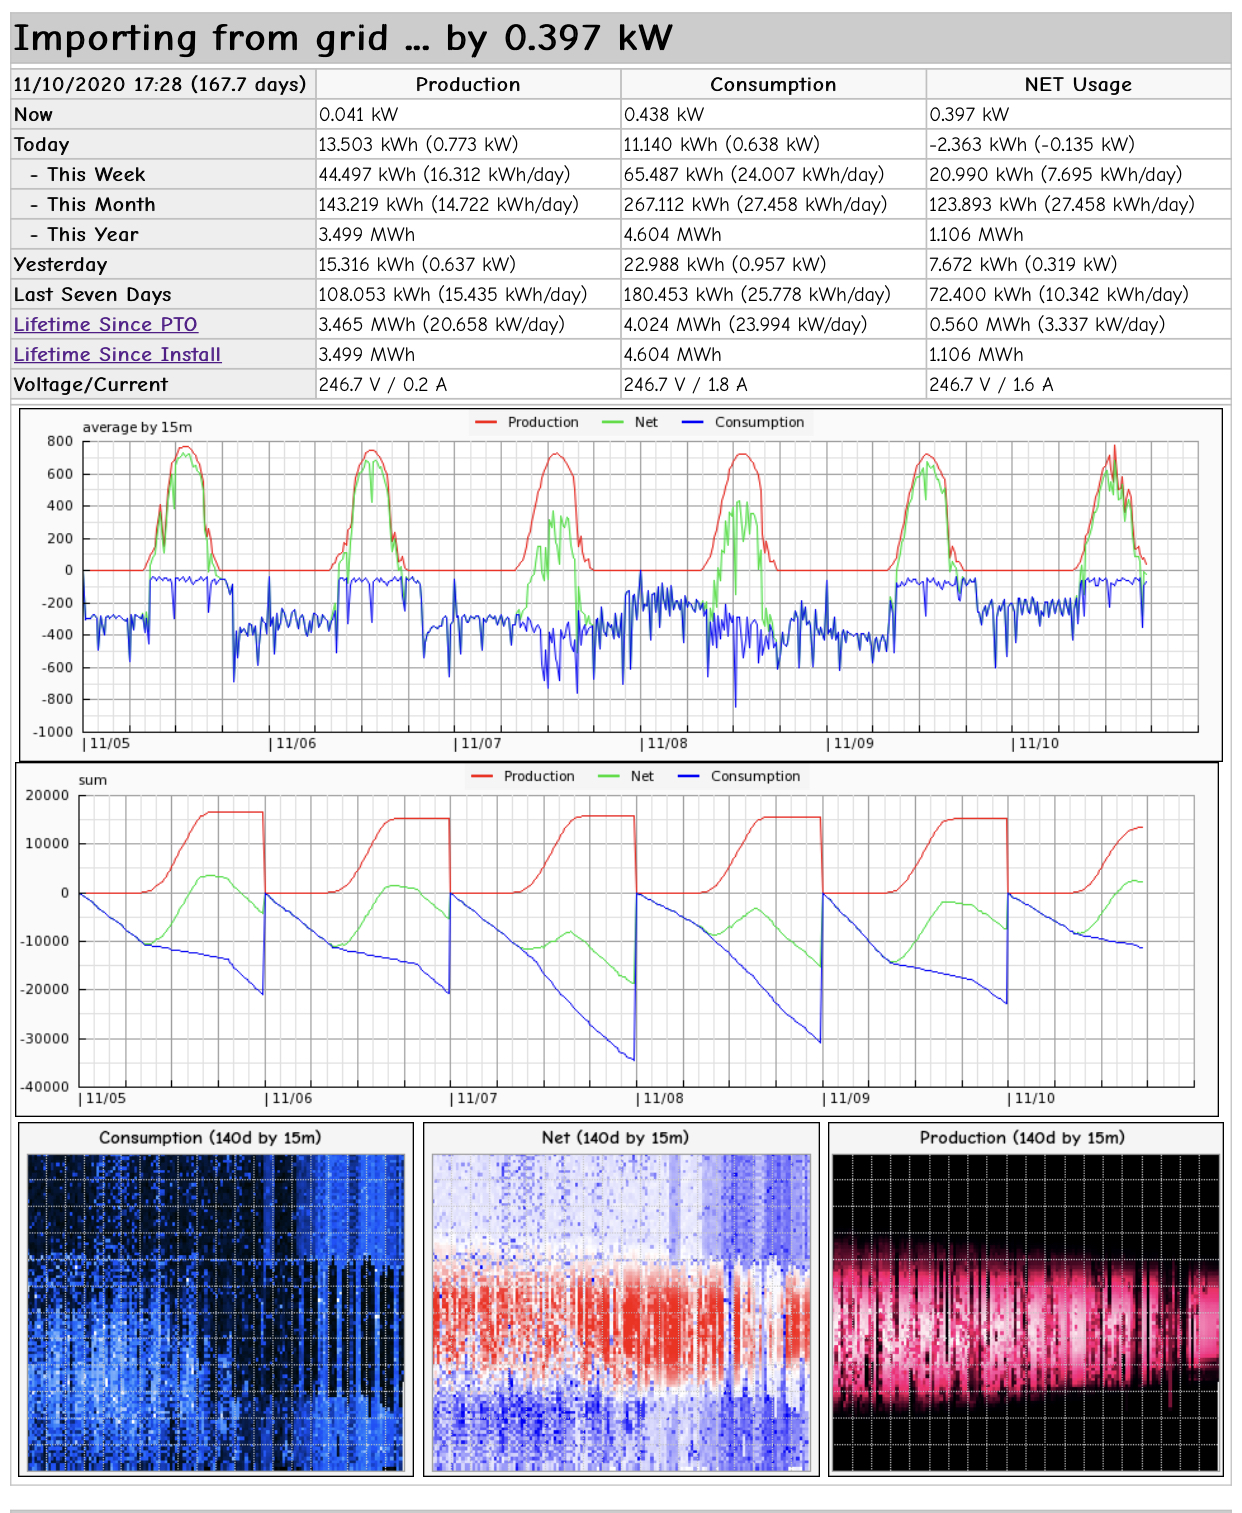
This is 7d graph, you can see the green spike, that is the point of issue,
I have checked in detail
Before the trouble, everything looks no issue,
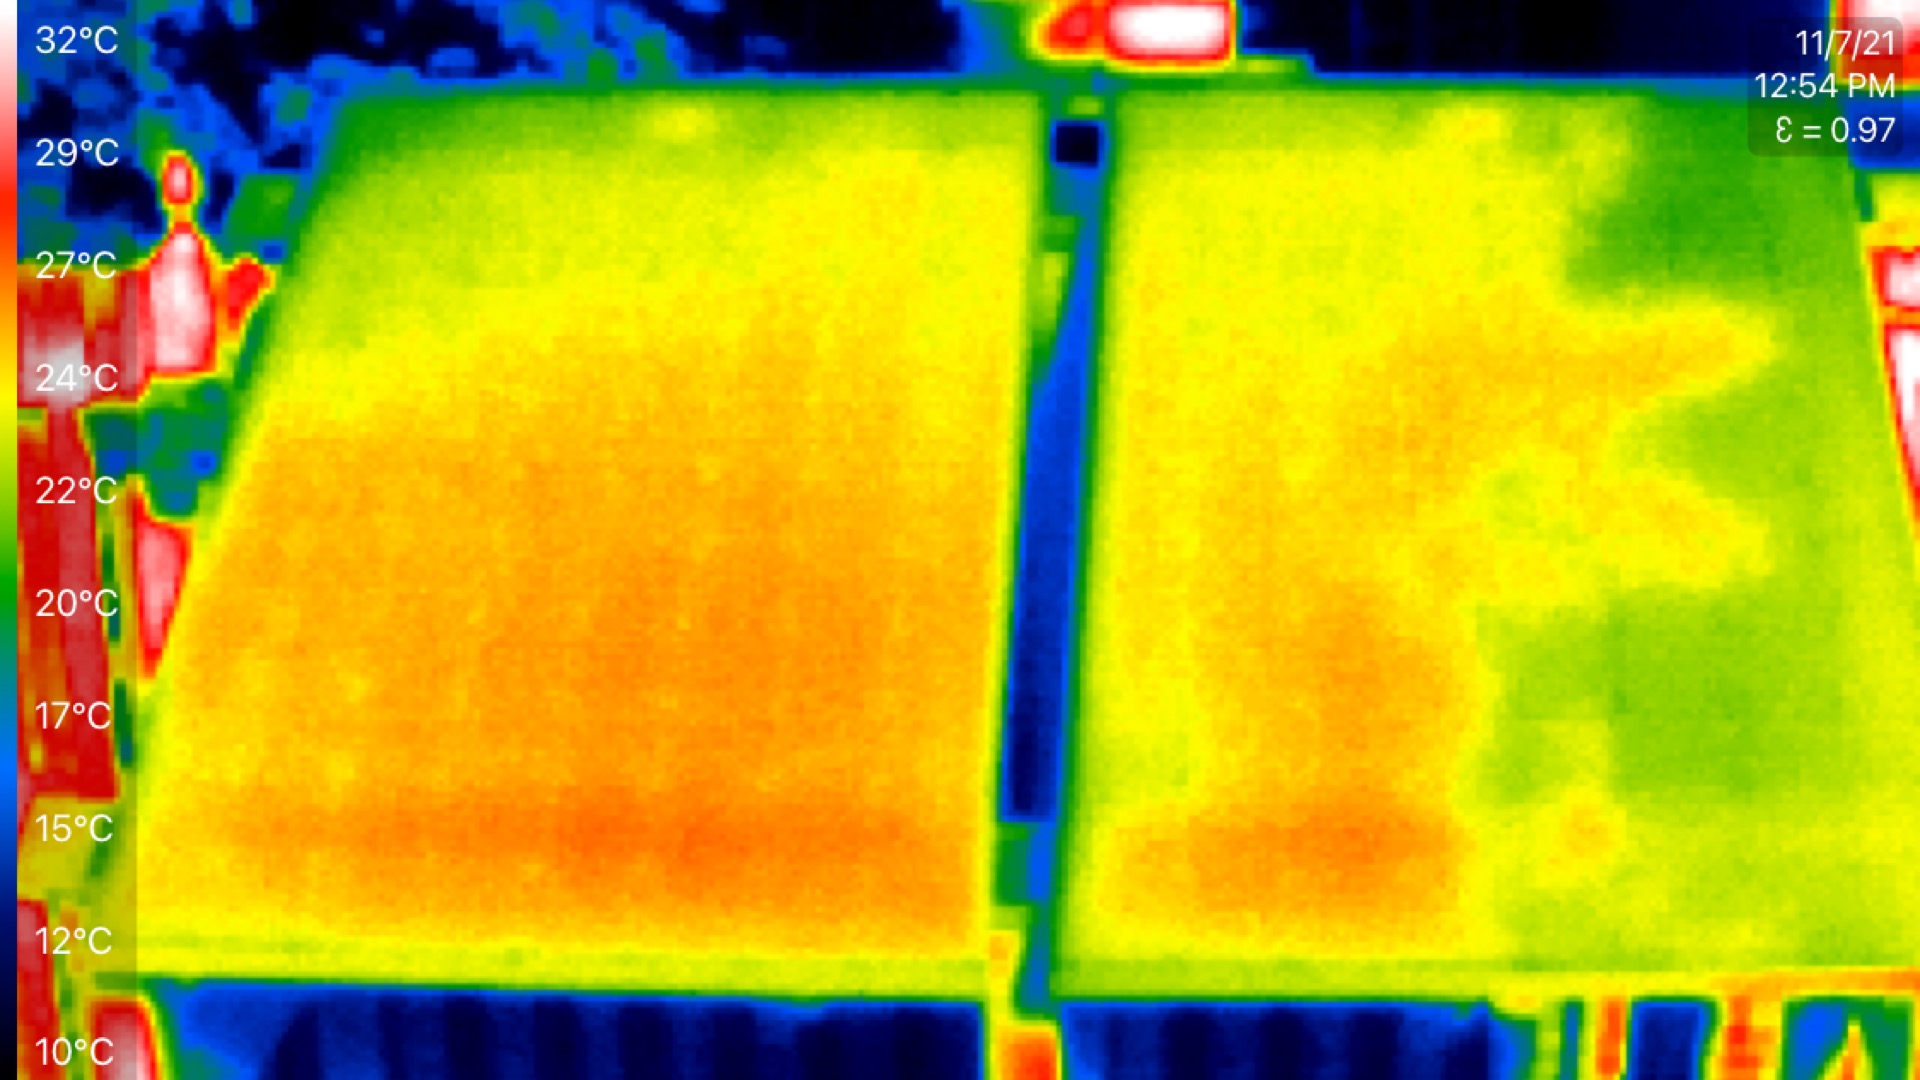
BUT, if check DC current, there is an different story
DC current is not 0A, it is 0.59A with 40.34V DC voltage.
micro inverter is not just shut-down, it is eating DC current, and temperature is going up
it is the temperature spike which has shown 7d graph.
First issue has started on Aug 17, and it become more and frequently,
Second issued inverter has started on Sep 2, and it become more and frequently.
3 inverters are twice a day, and 2 inverters are once per 2-3 days.
not sure, it will get worse or not.
Any idea or advice about it ?
ADD/EDIT:
This issue has started on AUG/SEP 2021
and, getting worse - more frequently,
Finally, it start to shutdown 3 times per inverter
ADD/EDIT : Bad news, It is affect on actual production
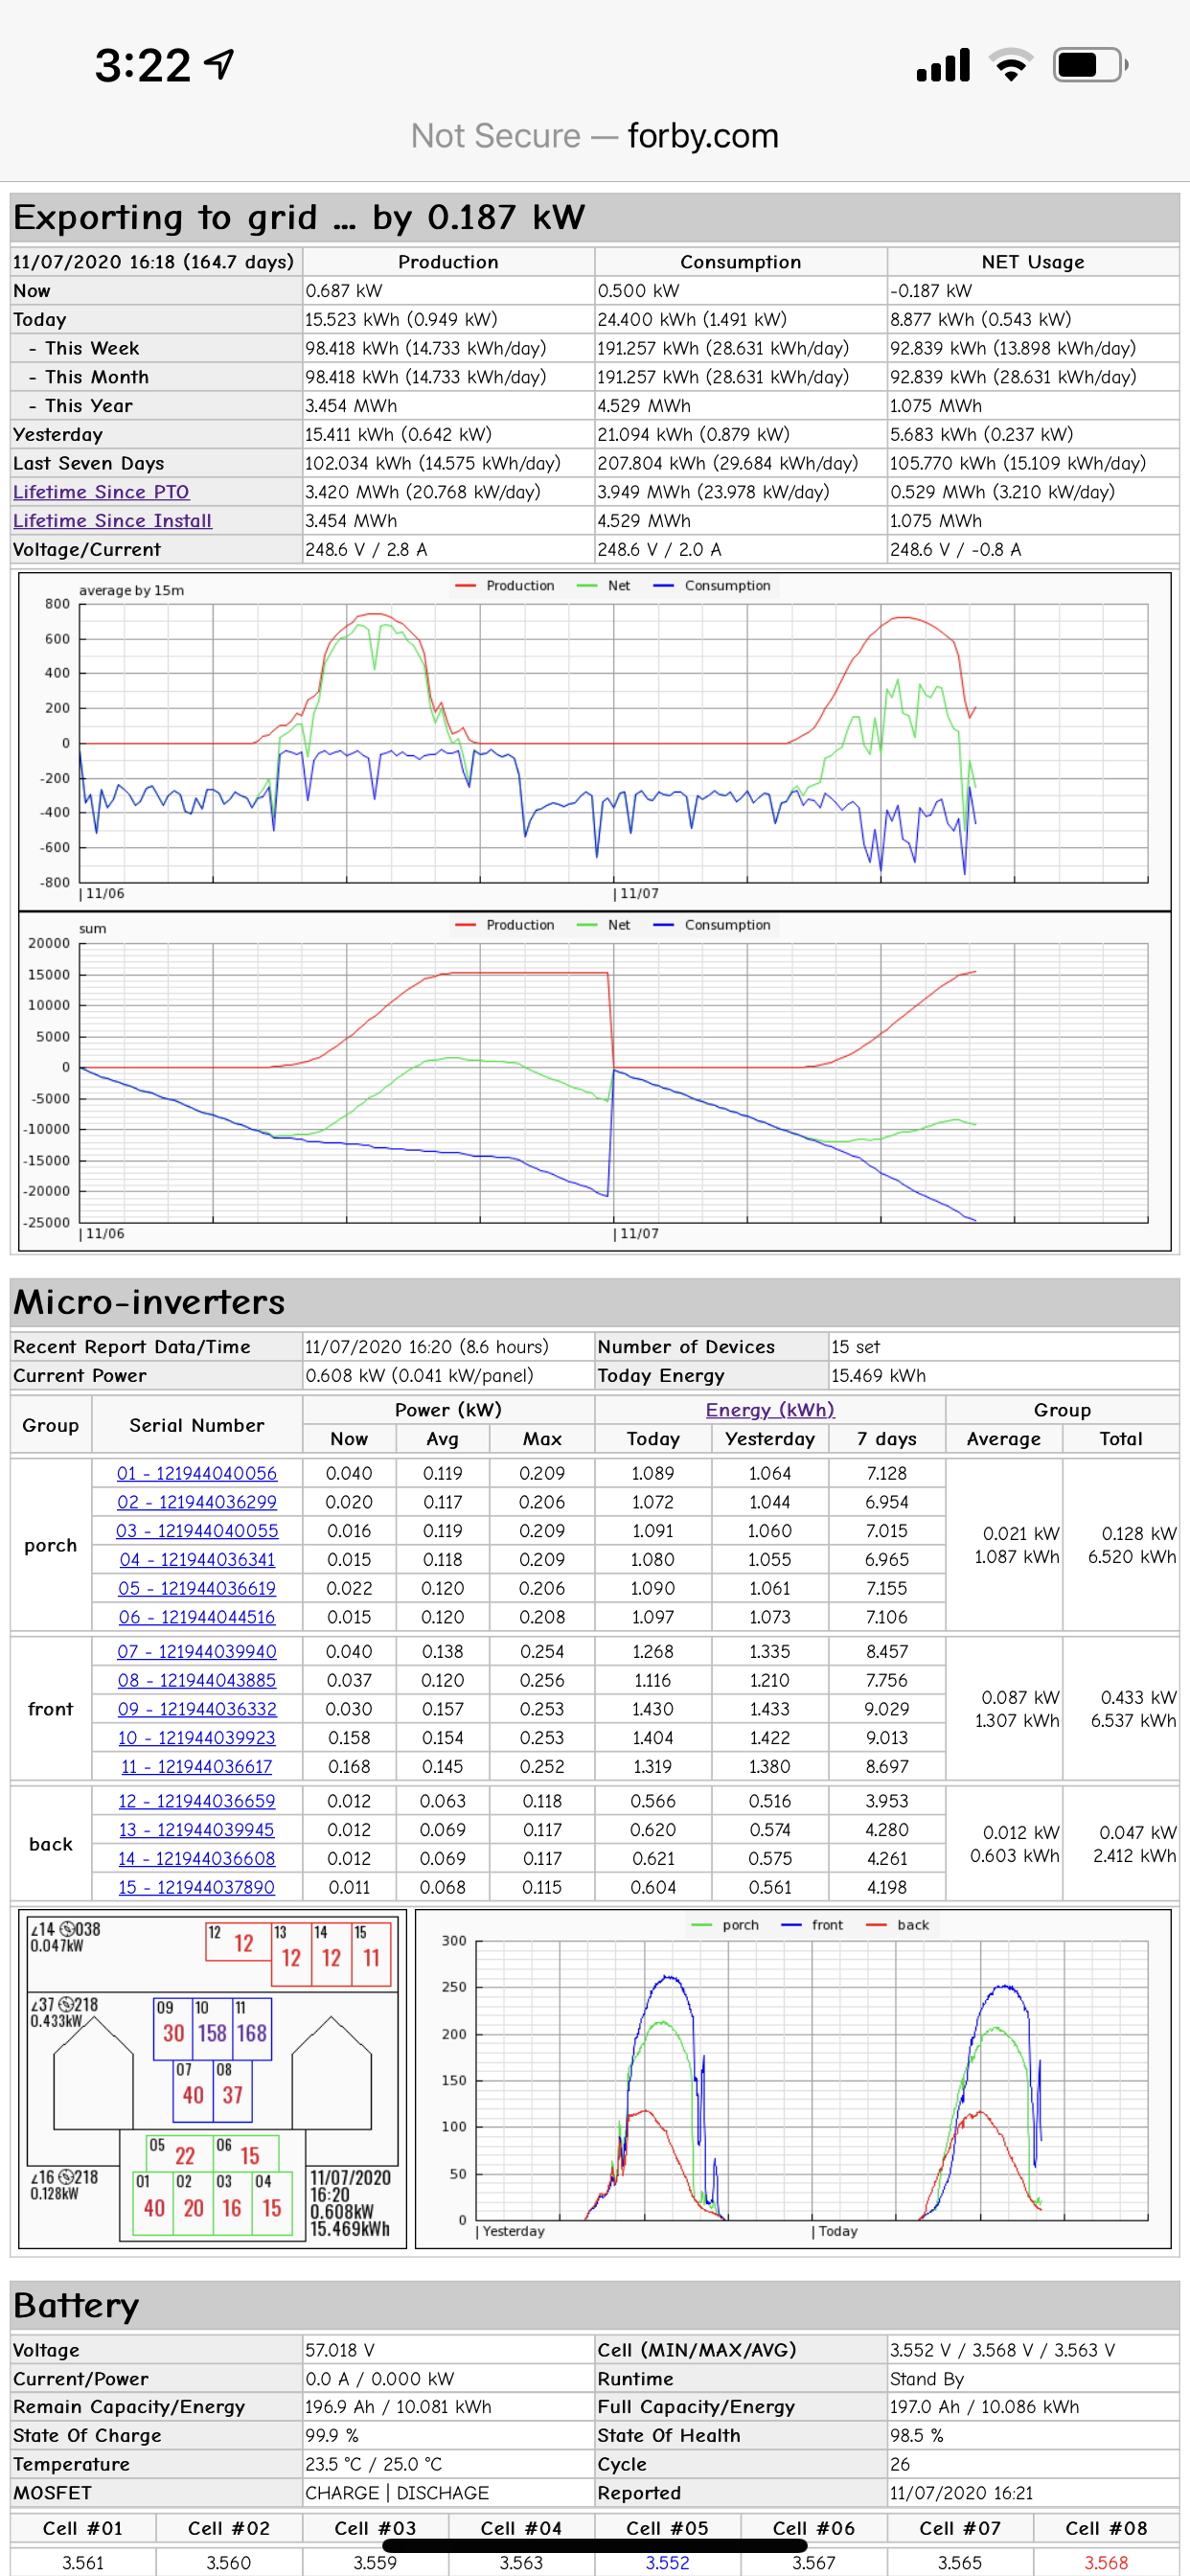
If see the green line, can see a power down at noon (it is average of 3 zone, 4-6 inverters are showing issue at only one zone even installed all at same time)
three inverters are showing error at similar time around noon.
it is power level using Production Meter Reading at Envoy every minute.
yes, production rate is slowing down little bit at noon,
It means, It is real Shut-down & No Production.
ADD/EDIT : Is it really grid instability ?
I am running my system using AC Coupling Mode, GRID voltage is 237V (20V lower than actual
grid voltage), and much stable. i have add RP230-30-10 filter, and 5 ferrite ring on L1/2 to filter
noise. The issue has not been improved at all, not worst or better, same.
i have 3 groups, the first string is, Group1-Group2-Junction-Envoy // 2nd string is Group3 - Junction - Envoy. No issue on 2nd string at all. Most of Group 1 show an issue, 1 out of 5 at group 2 shows an issue, 2-3 times per week.
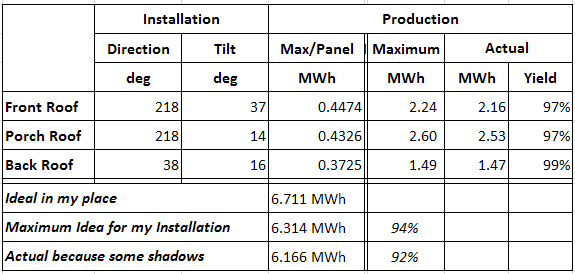
At my location, the maximum possible production is around 6.711MWh with my system.
* 15 LG350N1C with IQ7+
But, Panels are installed on the three different location with various direction/tilt.
When consider the installation, Maximum value is 6.314MWh
But, I just get 6.166MWh due to the shading of dome/tree.
My estimated production is 6.129MWh (NREL Model 6.185MWh),
One of critical issue with an AC coupling system is happening when battery has fully discharged.
There is no way to recover back.
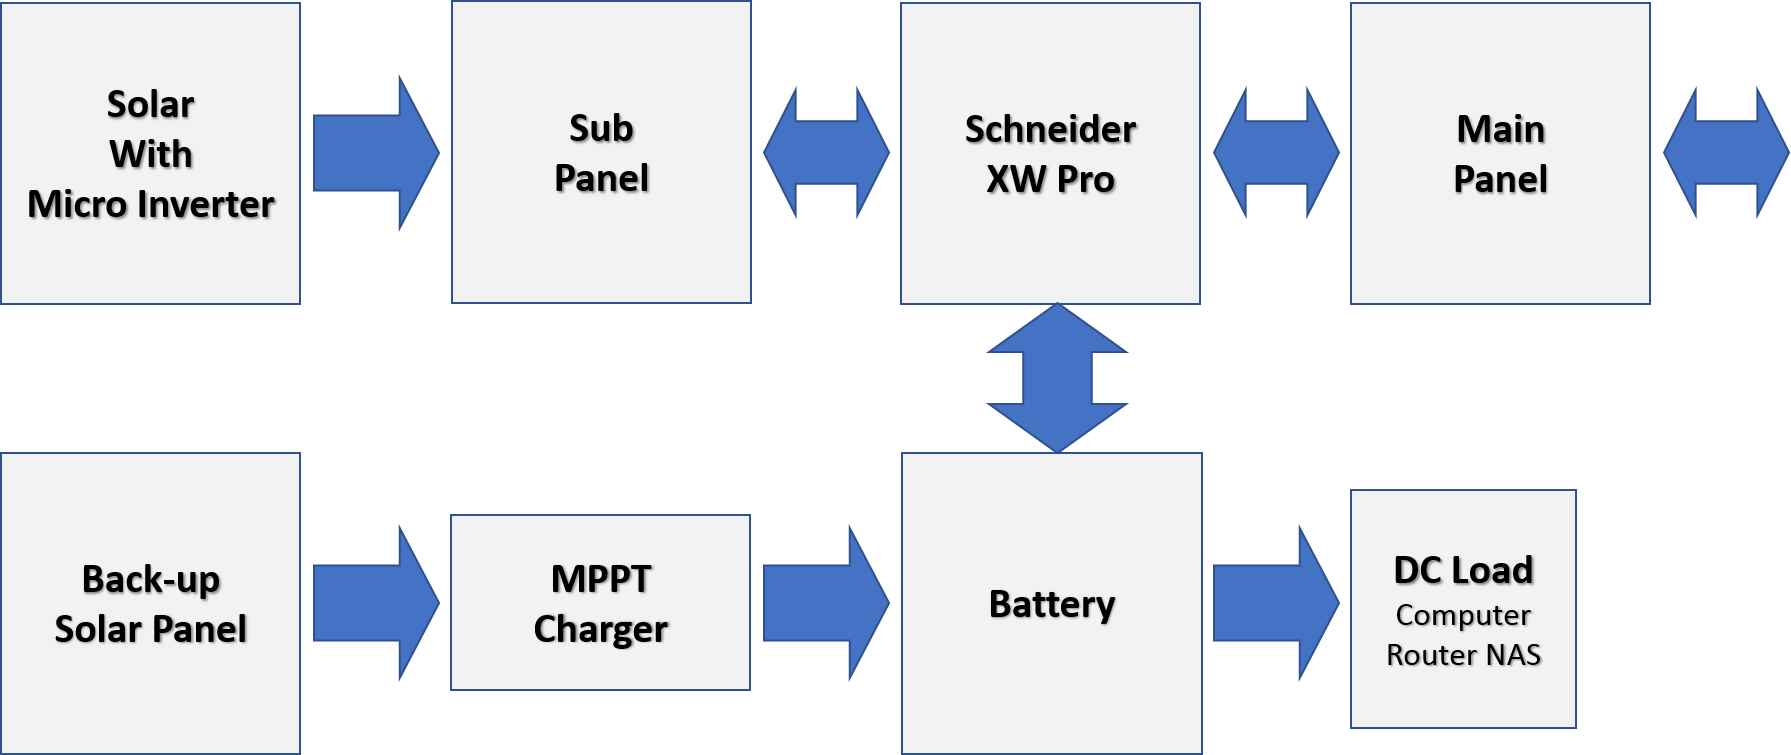
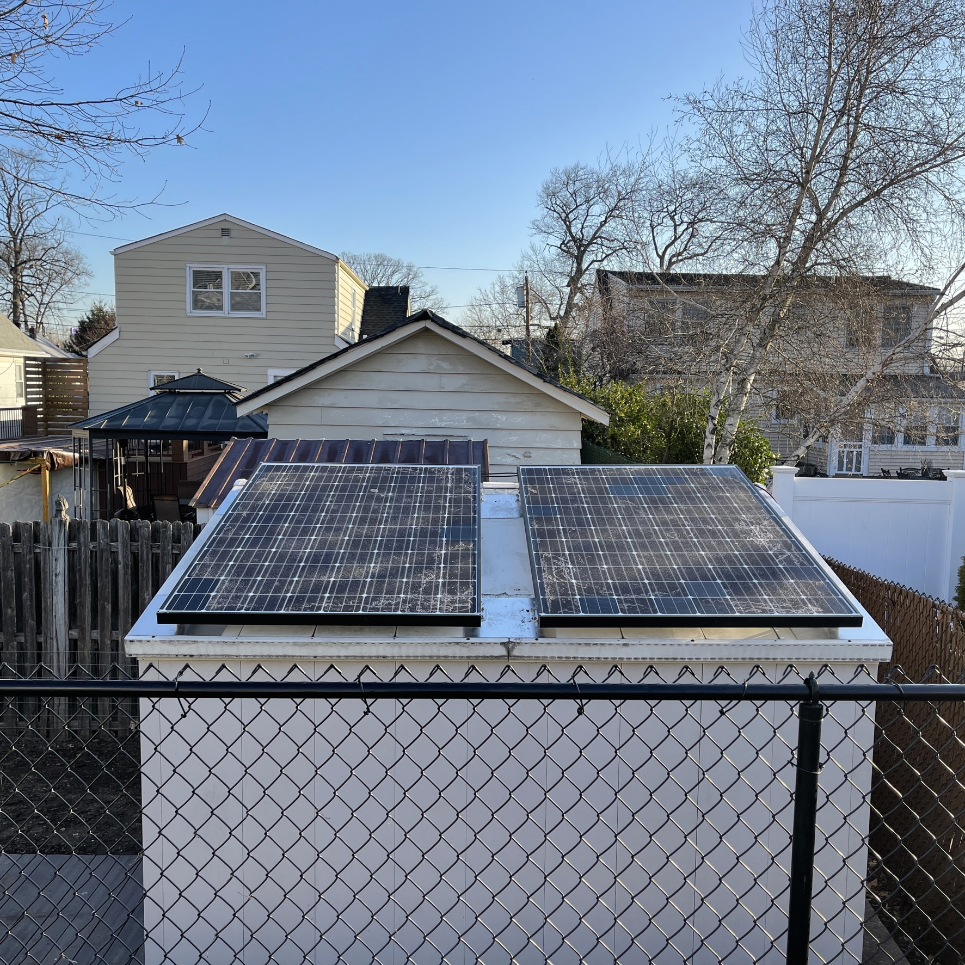
So, I decide to install an addtional DC coupling
as below
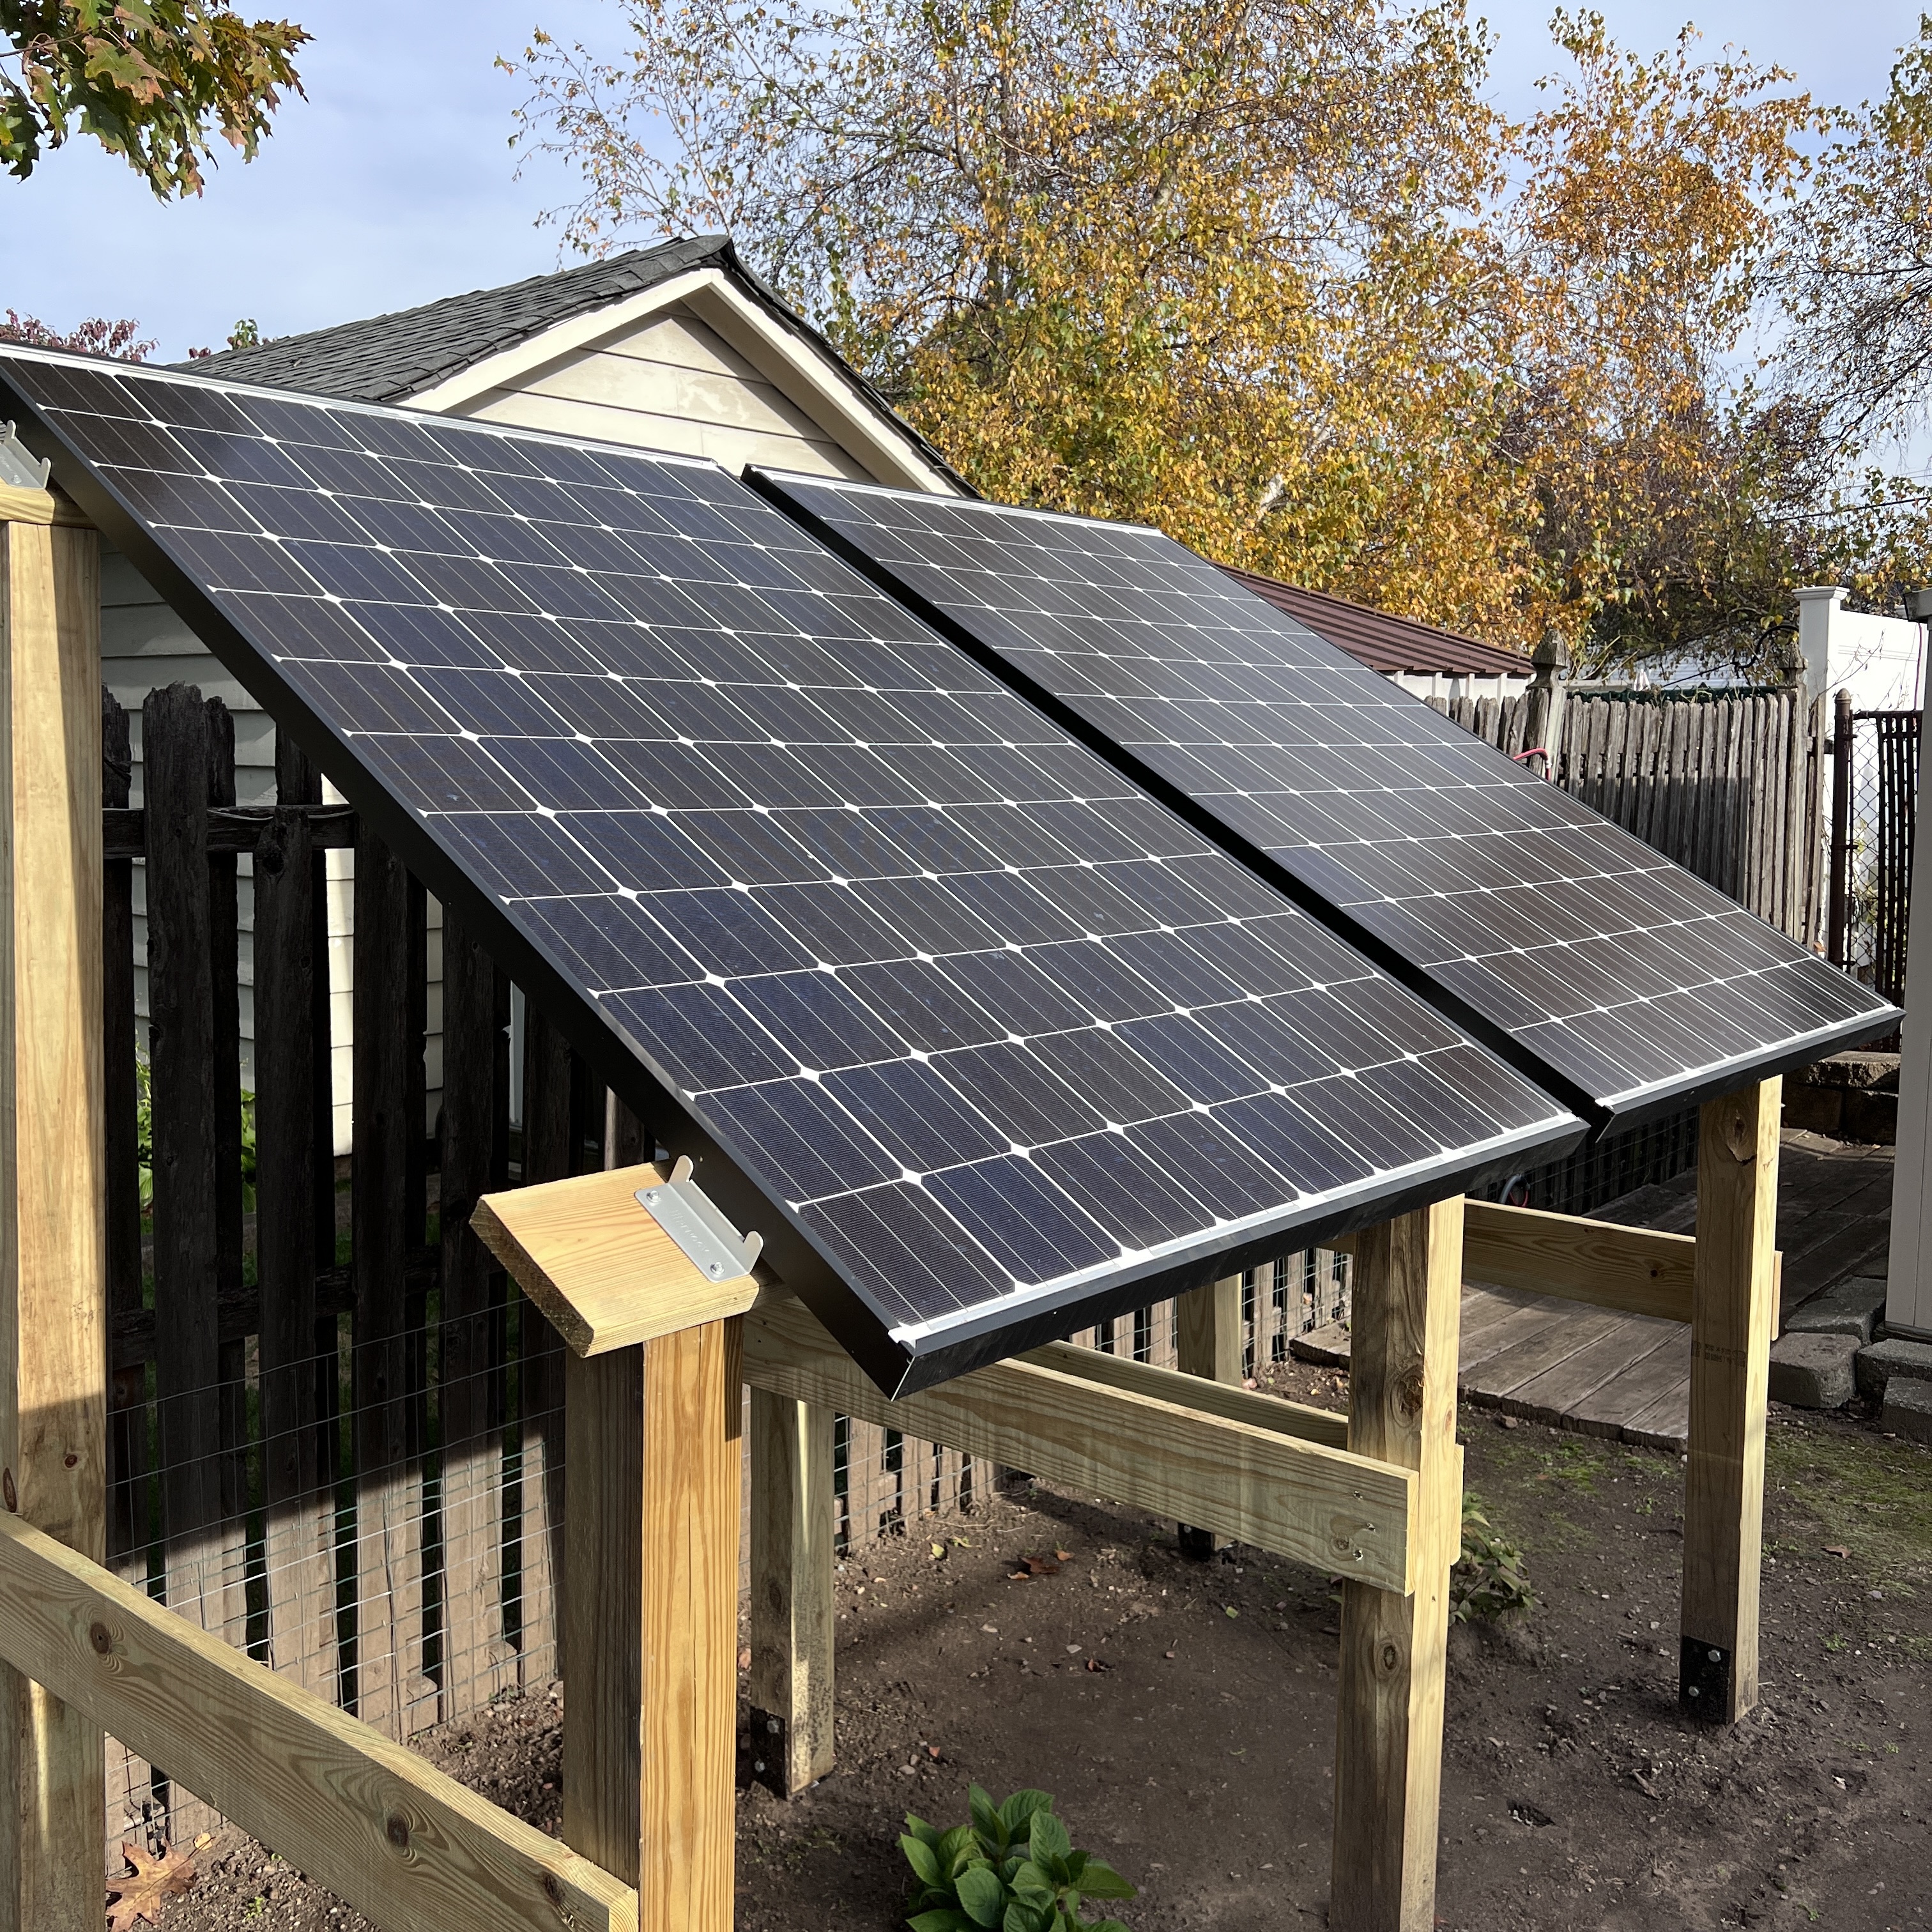
Two panasonic HIT340 module on the shed at my back yard.
2 pannels are connected in series, it can generate 680W. (practically, it can generate 760~780W).
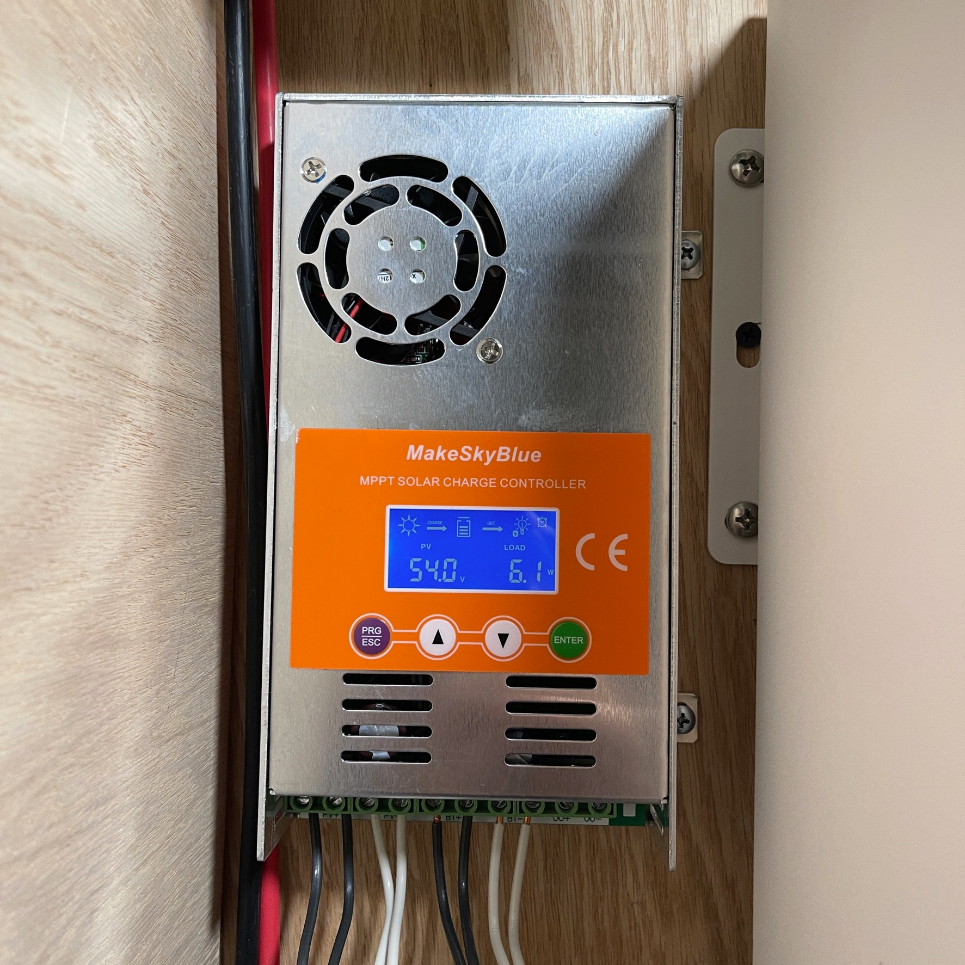
I have installed cheap MPPT charger,
Actually, this model can support 190V input, and working up to 160V.
When I make 2s 96cell module, Voc is around 130-140V. and Vmppt is around 120V.
It is too hard to use a generic 150V charger.
but, this MPPT controller is perfect in my case.
This is final connection,
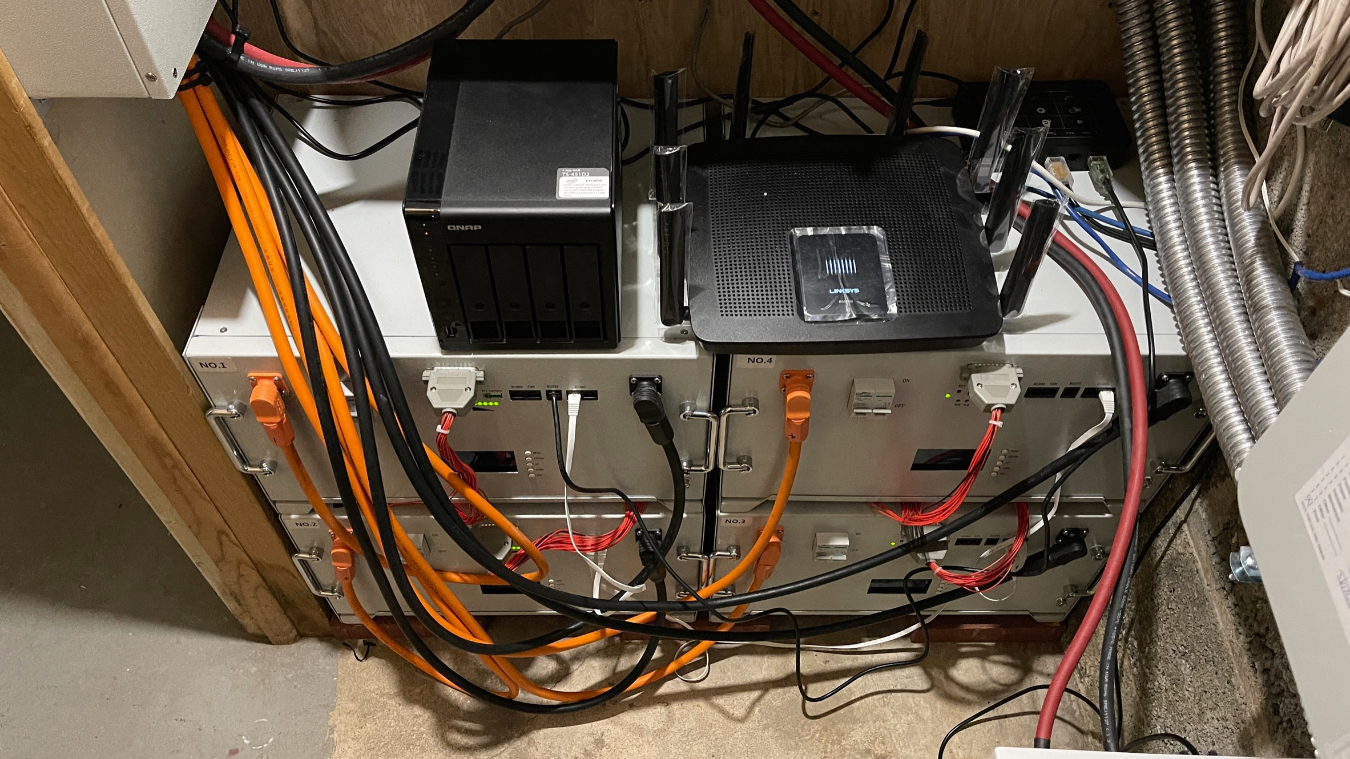
I have installed 200W 48V to 12V DC2DC for Mini-computer (monitoring), NAS (Data storage & Web Server)
and Wireless Router (to keep on an in-house network).
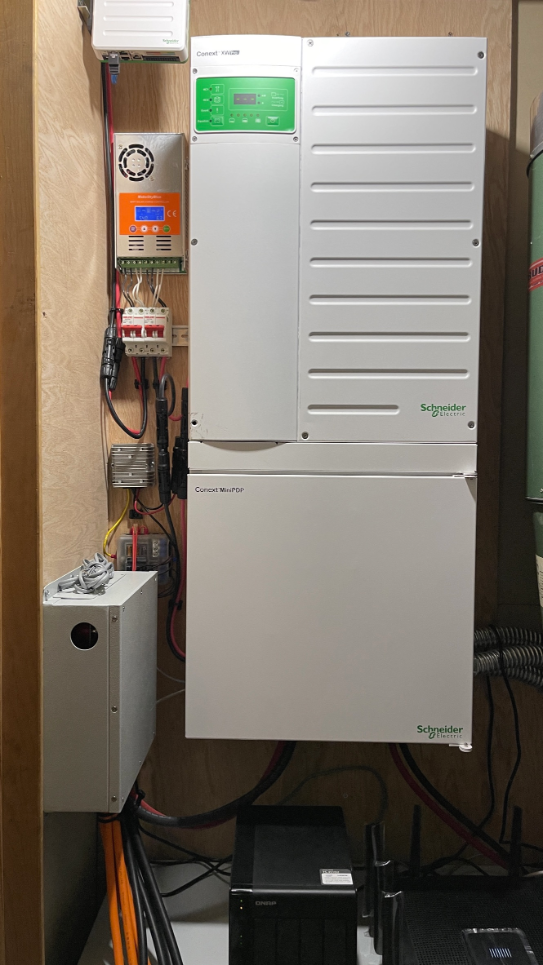
I have installed 30kWh battery power
The useable capacity is around 24~25kWh. and, It is enough to supply 24 hours full power usage.
or 2-3 days limited power usage at my house.
http://www.forby.com/solar/?detail=1&offset=0
Really, simple information but hard to find
Recently, I have just updated little bit..
Add an accmulating graph, It can make me easy to read how much power has generated/used easily.
Around 50 yard in front of my house, there are some big trees.
I make some shadow on my house now.
Power gain is not even, and, drop power at end of day ~
actually, the shadow is not much horrible to reduce the power to the diffusion power level.
but, It is a problem with solar power generation.
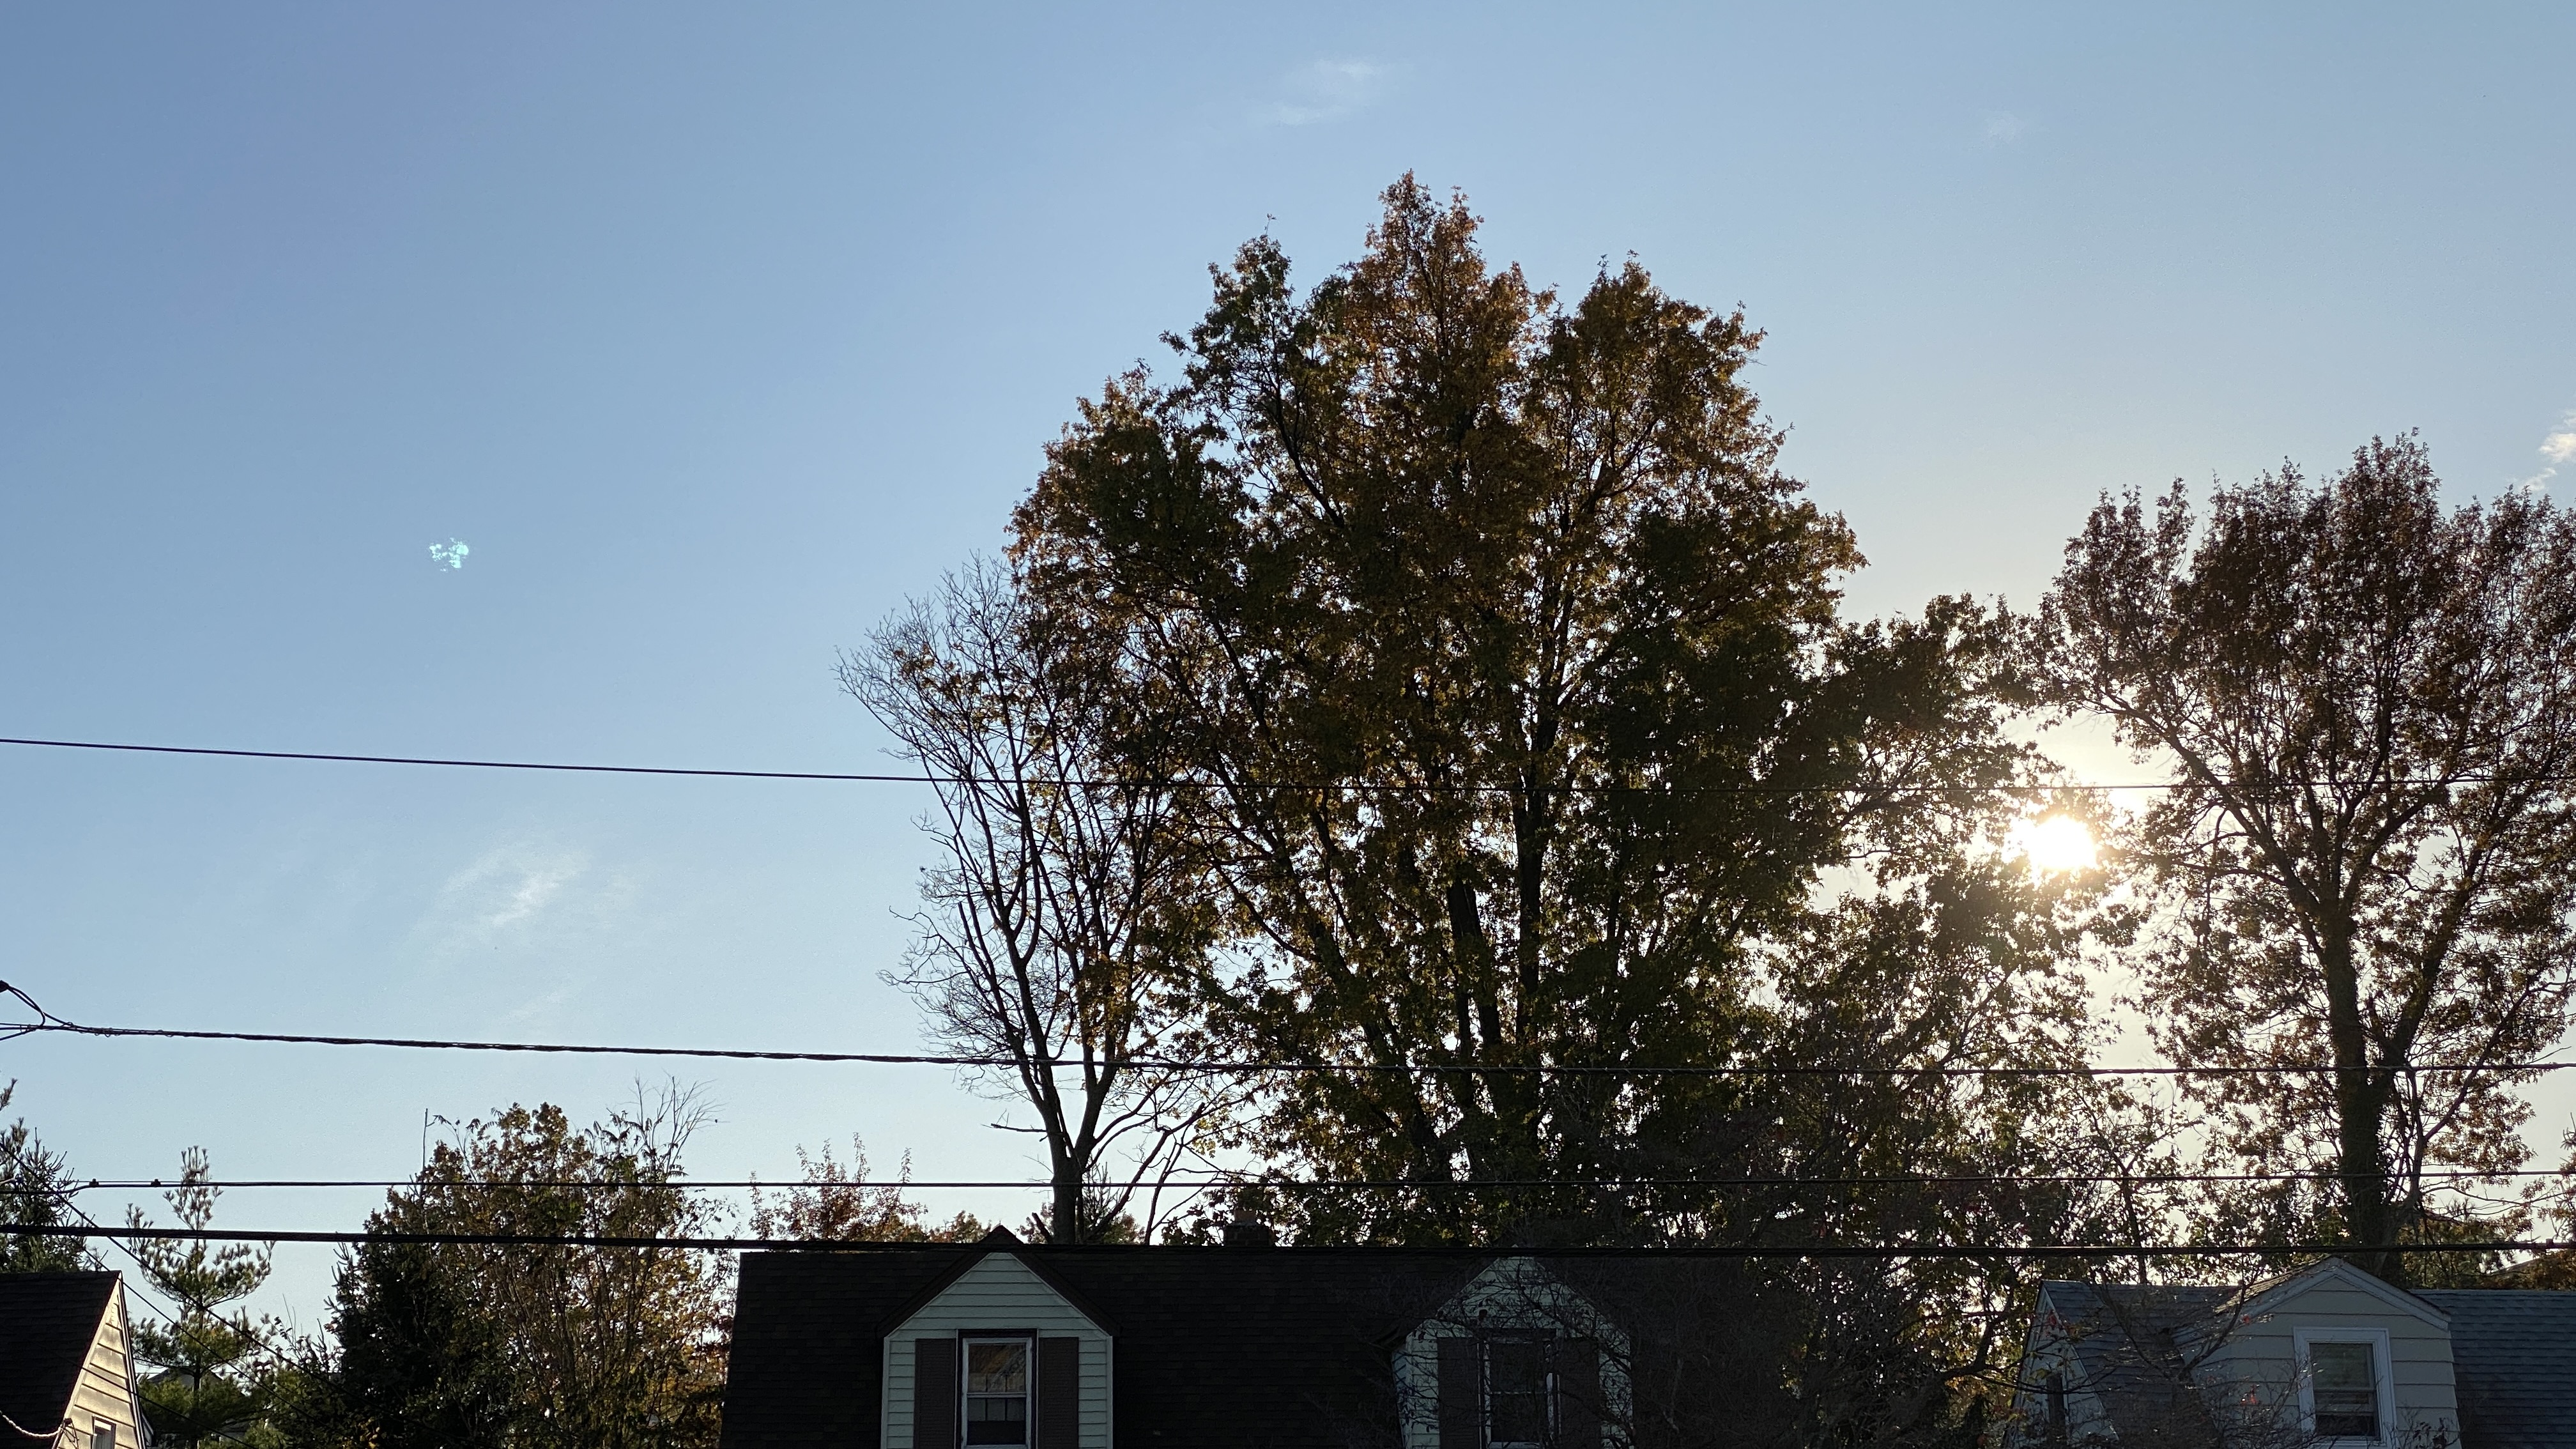
I hate the trees, but, I can do nothing ~ because it is not belong to me.
When install a solar system, need to consider more carefully,