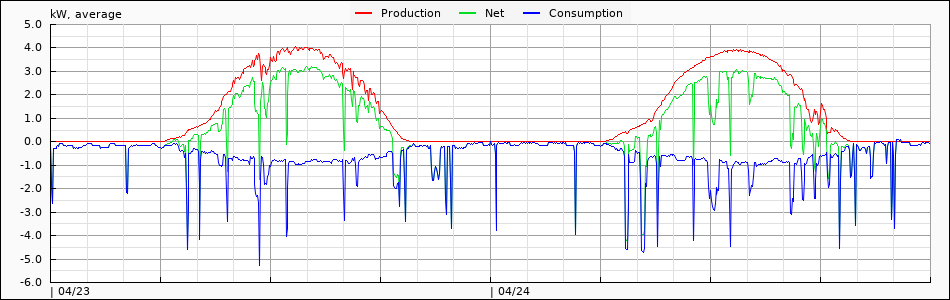
The blue line is the power consumption, and red-line is the production power from Enphase Gateway.
You can see some strange behavior, Power consumption looks line a reflection of production.
High production power stage it is showing much deeper
it can be happening when Consumtion CT connection is no good, or not climped well at L1/L2 line side.
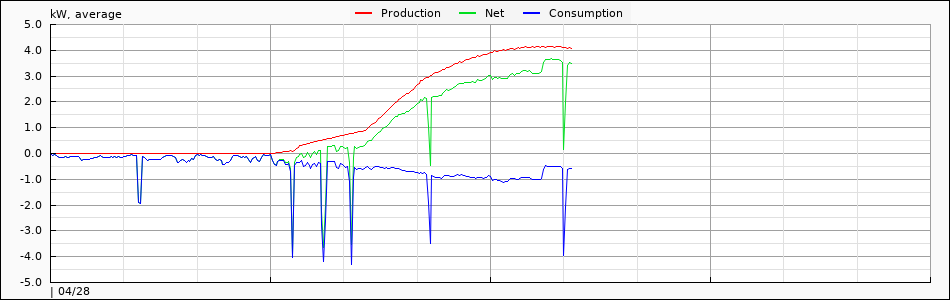
I just fixed the connection of Consumption CT, and the power consumption become normal, it is matched with actual value around 500W.